7
$\begingroup$

I want to do a data science project. I want to use price history to predict future prices.

I want to use correlation(y, y_pred) as my loss function but I found it's hard to calculate first deter, and second deter.

Has anyone used correlation as loss function, and is it good?

$\endgroup$
3

4 Answers 4

6
$\begingroup$

I think Dave's answer points out the most pressing issues:

  • translational invariance
  • Absolute scale invariance

In Tensorflow we can define our correlation function:

class CorrLoss(tf.keras.losses.Loss):

    def call(self, y_true, y_pred):
        res_true = y_true - tf.reduce_mean(y_true)
        res_pred = y_pred - tf.reduce_mean(y_pred)
        cov = tf.reduce_mean(res_true * res_pred)
        var_true = tf.reduce_mean(res_true**2)
        var_pred = tf.reduce_mean(res_pred**2)
        sigma_true = tf.sqrt(var_true)
        sigma_pred = tf.sqrt(var_pred)
        return - cov / (sigma_true * sigma_pred)

And quickly whip up a simple linear model:

model = tf.keras.Sequential([
    layers.Dense(input_shape=[1,], units=1)
])

And a data set that is learnable by this model:

x = tf.random.normal((1000,))
y = 5 * x + 10 + tf.random.normal((1000,))

Training with our choice of loss function, model, and data, we can visually understand that correlation alone is not sufficient. As Dave describes, least squares is often effective.
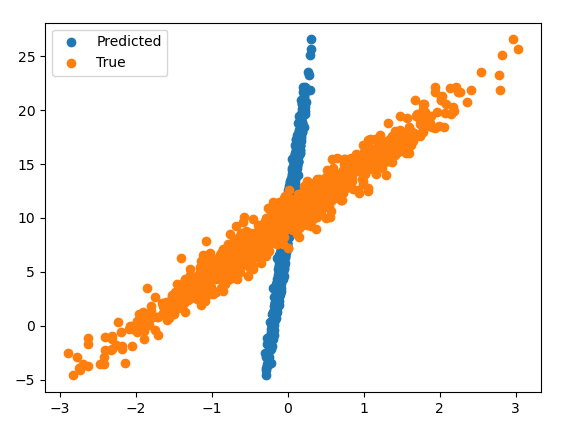
enter image description here

Mostly for my own amusement, I considered if maximizing $\mathbb{E}[Y \hat Y]$ would fare any better than maximizing Pearson's correlation.

Here is the custom loss function:

class ProdLoss(tf.keras.losses.Loss):

    def call(self, y_true, y_pred):
        return -tf.reduce_mean(y_true * y_pred)

The following is a close success over the consistently-horrible choice of correlation:

enter image description here

And often it would look better, but it wasn't reliable! It would also often look like this:

enter image description here

Interestingly, the product moment will tend to ignore the true values by making the predicted values extreme. I noticed this by taking the same problem and increasing the number of epochs to $10^4$.

enter image description here

Thus the correlation and mixed moment are unreliable loss functions for achieving $Y \approx \hat Y$.

$\endgroup$
4
  • $\begingroup$ Note that I used epochs=1000, which is plenty for this problem when using mean squared error as loss. $\endgroup$
    – Galen
    Commented Sep 18, 2022 at 0:37
  • 1
    $\begingroup$ +1 The shame of it is that both will have the OLS solution as a possible solution…among the infinitely many other solutions that minimize the loss. $\endgroup$
    – Dave
    Commented Sep 18, 2022 at 0:46
  • $\begingroup$ I use some related techniques here: stats.stackexchange.com/a/589221/69508 $\endgroup$
    – Galen
    Commented Sep 19, 2022 at 1:10
  • $\begingroup$ I asked a related type of question here: stats.stackexchange.com/questions/589160/… $\endgroup$
    – Galen
    Commented Sep 19, 2022 at 1:13
8
$\begingroup$

UPDATE (I WAS WRONG)

Maximizing correlation misses a lot and makes for a terrible function to optimize.

For instance, correlation will not detect if you consistently predict too high or too low.

For every real $a$: $$ corr(y, \hat y) = corr(y, a+\hat y) $$

In fact, for any real $a$ and positive $b$:

$$ corr(y,\hat y) = corr(y,a+b\hat y) $$

Concretely, if your true values are $y=(1,2,4,6,5)$, $\hat y=(11, 21, 41, 61,51)$ makes for terrible predictions but does have a perfect correlation with $y$. (In this example, $a=1$ and $b=10$.)

Minimizing square loss implies a maximization (not minimization) of correlation between observed and predicted values, but the reverse implication does not apply.

However, since minimizing square loss implies a maximization of correlation (at least in linear models), you can minimize square loss and get maximized correlation. Correlation will not be perfect unless square loss is zero, but you can still maximize the correlation in the sense that no other regression coefficients will do better (though some will result in equal correlation but worse or equal square loss).

Minimizing square loss is what happens in ordinary least squares linear regression and is completely standard in statistics and machine learning.

$\endgroup$
1
  • $\begingroup$ My simulations on the statistics Stack give additional examples of the dangers of using correlation or (worse) squared correlation as a measure of model performance. $\endgroup$
    – Dave
    Commented Sep 18, 2022 at 0:57
6
$\begingroup$

Correlation does not make a useful loss function for many reasons. One reason is that correlation only measures how linearly related two variables are. A model can have a strong linear relationship between observed and predicted values and still make terrible predictions.

For example:

observed = [1, 2, 3, 4]
predicted = [101, 102, 103, 104]

Those observed and predicted values are perfectly correlated (i.e., r=1) but the predictions are way off.

$\endgroup$
0
$\begingroup$

your loss function should reflect what you prefer. the semantics of the situation are important

Signal A: 1 1 1

Signal B: 2 2 2

Signal C: 0 2 0

Signal D: 2 0 2

B,C,D all give the same MSE and MAE. but signal B has the highest correlation.

An alternative is to Use Pearson correlation to amplify the loss loss = (2-pearson) * huber * scale

Note 1=high correlation,0=no correlation,-1=negative correlation so you want

(2-1=1) is no loss so no amplification

(2-0=2) is some loss so some amplification

(2-(-1)=3) is more loss so more amplification

where scale allows you to control the amplification

I haven't tried it. I'm planning on experimenting with it. If you try and it works, let me know.

$\endgroup$

Your Answer

By clicking “Post Your Answer”, you agree to our terms of service and acknowledge you have read our privacy policy.

Not the answer you're looking for? Browse other questions tagged or ask your own question.