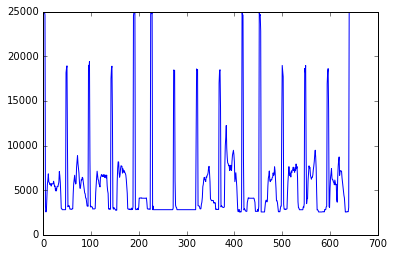
This is very simple. Let's say your data in Panda format (named data_df), and extracting peaks/spikes over a certain threshold (e.g. 15000 here) is simply:
data_df[data_df > 15000]
If this data is sitting in a particular column, you can use this instead:
data_df[data_df['column_name'] > 15000]
These will return the peak values.
Updated Answer:
If you want local extreme points (e.g. maximum or minimum ) around each peak, check scipy.signal.argrelextrema in Scipy. A concrete example:
Let's make a artificial random data with random spikes:
import numpy as np
import matplotlib.pyplot as plt

random_number1 =np.random.randint(0,200,20)
random_number2=np.random.randint(0,20,100)
random_number=np.concatenate((random_number1,random_number2))
np.random.shuffle(random_number)
plt.plot(random_number)
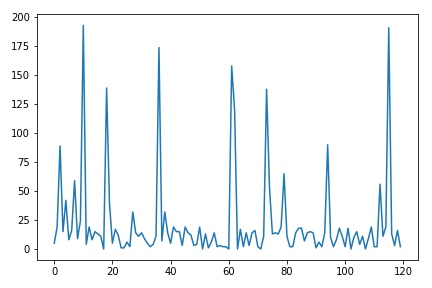
Now using argrelextrema function you will find the index of relative extreme values (either minimum or maximum)
c_max_index = argrelextrema(random_number, np.greater, order=5)
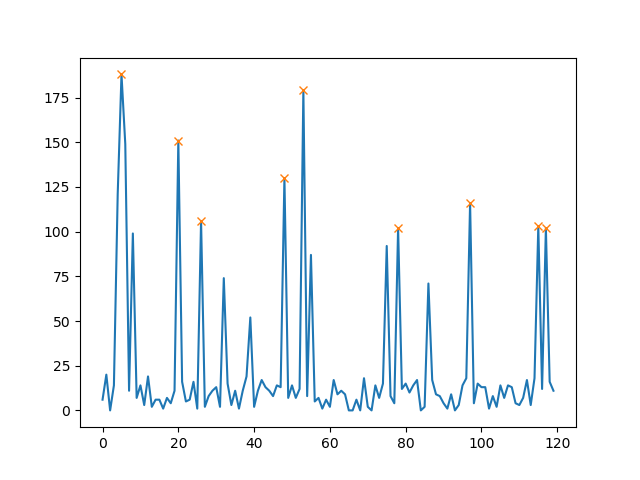
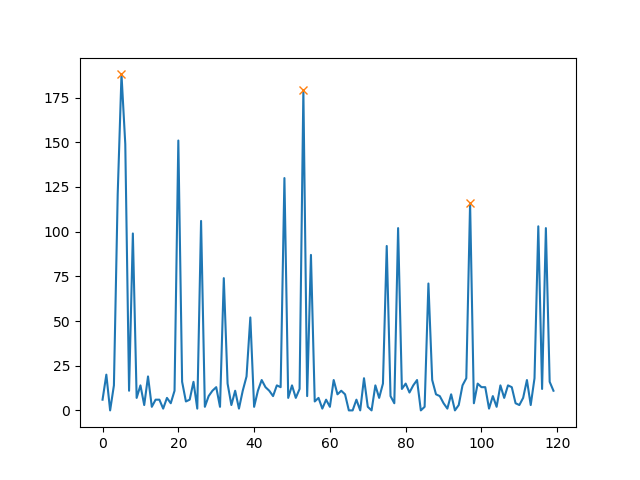
Please make sure you understand the "order" option. It basically look around 5 neighbouring points, and it returns the maximum in this case. And you can see how it works by pinpointing the found points on the actual graph like this:
plt.plot(random_number)
plt.scatter(c_max_index[0],random_number[c_max_index[0]],linewidth=0.3, s=50, c='r')
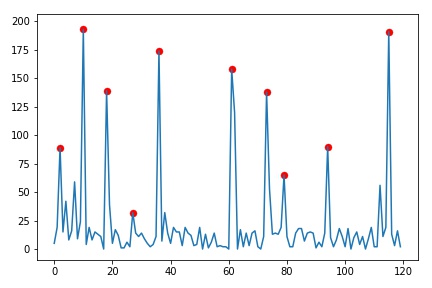
Note that you can retrieve peak points via random_number[c_max_index[0]], and c_max_index are just indexes of the extreme points.

