added 130 characters in body
Source Link

In my dataset, I have two numeric revenue features, one for each month, and two categorical features one for region and other for value segment. what I want to do is compare these two revenues col by col for each region and facet wrap by value segment. Is there any way to do that in ggplot2?

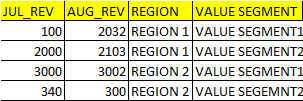
enter image description here sample data :

enter image description here

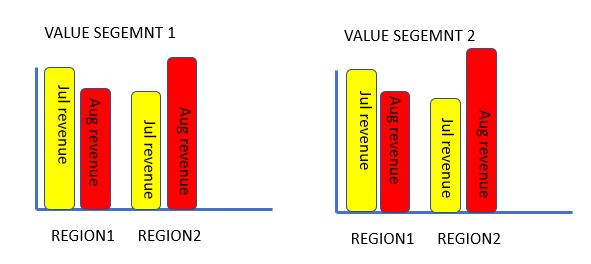
the image in my mind:

enter image description here

In my dataset, I have two numeric revenue features, one for each month, and two categorical features one for region and other for value segment. what I want to do is compare these two revenues col by col for each region and facet wrap by value segment. Is there any way to do that in ggplot2?

sample data :

enter image description here

the image in my mind:

enter image description here

added 87 characters in body
Source Link

In my dataset, I have two numeric revenue features, one for each month, and two categorical features one for region and other for value segment. what I want to do is compare these two revenues col by col for each region and facet wrap by value segment. Is there any way to do that in ggplot2?

enter image description here

In my dataset, I have two numeric revenue features, one for each month, and two categorical features one for region and other for value segment. what I want to do is compare these two revenues col by col for each region and facet wrap by value segment. Is there any way to do that in ggplot2?

In my dataset, I have two numeric revenue features, one for each month, and two categorical features one for region and other for value segment. what I want to do is compare these two revenues col by col for each region and facet wrap by value segment. Is there any way to do that in ggplot2?

enter image description here

Source Link

Plot two categorical variables against two numeric variable in ggplot

In my dataset, I have two numeric revenue features, one for each month, and two categorical features one for region and other for value segment. what I want to do is compare these two revenues col by col for each region and facet wrap by value segment. Is there any way to do that in ggplot2?