added 1443 characters in body
Source Link

Here I'm talking mostly about cost function but expect something similar for them in role of metrics as well. (I'm thinking about the visualization now

Example:

enter image description here

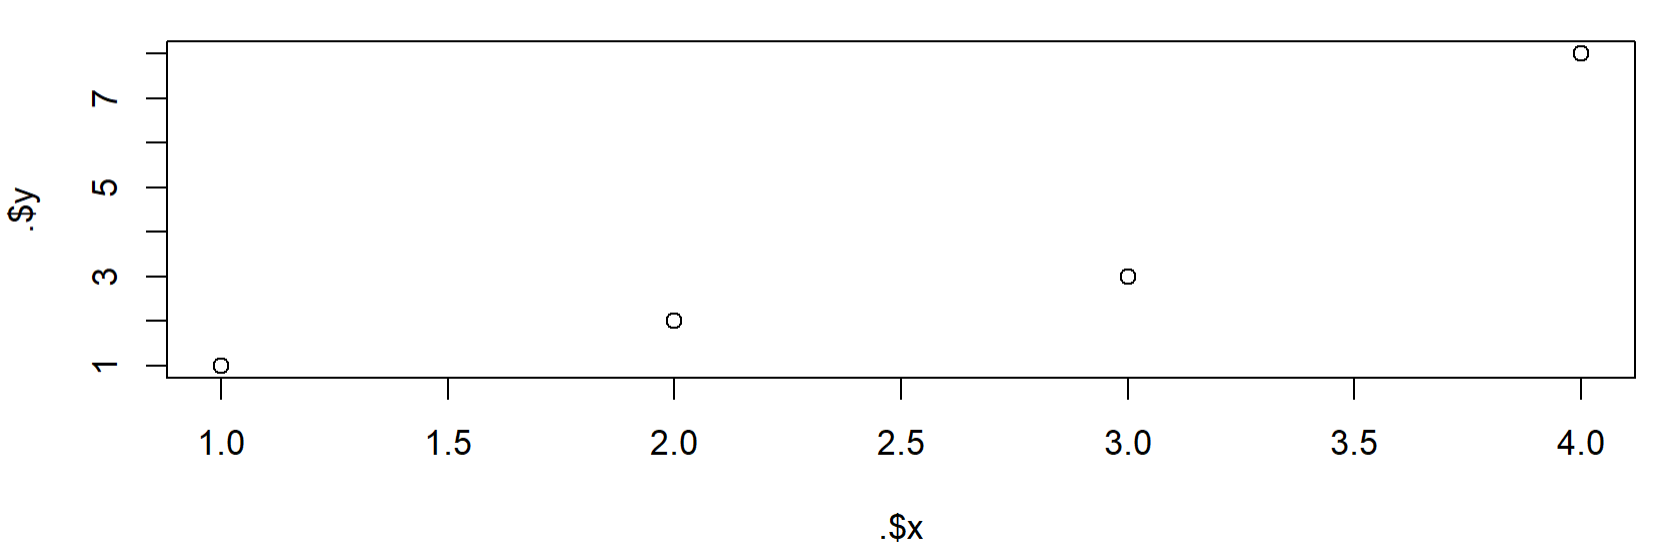
Here I create a 4 observations example. I use RMSE for comparision because MSE gives squared residuals, we want to get them back to the answer will be updated)original non-squared scale at first. The first 3 observations imply a very plain model y = 1 * x + 0. Then I compare it with the model y = 2*x using residuals

> tibble(x=1:4, y=c(1,2,3,8)) %>% 
+     {plot(.$x, .$y); .} %>% 
+     mutate(base_pred=x * 1) %>% 
+     mutate(outl_pred=x * 2) %>% 
+     mutate(across(ends_with('pred'), ~abs(. - y), 
        .names='{str_remove(col, "_pred")}_resi')) %>% 
+     print() %>% 
+     rename_with(~str_remove(., '_resi')) %>% 
+     summarise(across(c(base, outl), list(
+         mae=~mean(.),
+         rmse=~sqrt(mean(. ^ 2))))) %>% 
+     select(ends_with('mae'), everything())

      x     y base_pred outl_pred base_resi outl_resi
  <int> <dbl>     <dbl>     <dbl>     <dbl>     <dbl>
1     1     1         1         2         0         1
2     2     2         2         4         0         2
3     3     3         3         6         0         3
4     4     8         4         8         4         0

  base_mae outl_mae base_rmse outl_rmse
     <dbl>    <dbl>     <dbl>     <dbl>
1        1      1.5         2      1.87

You may see that base_model is better if you use MAE. Otherwise y=x*2 gives you better metric with RMSE because it suffers more and is more focused on outliers.

Here I'm talking mostly about cost function but expect something similar for them in role of metrics as well. (I'm thinking about the visualization now, the answer will be updated)

Here I'm talking mostly about cost function but expect something similar for them in role of metrics as well.

Example:

enter image description here

Here I create a 4 observations example. I use RMSE for comparision because MSE gives squared residuals, we want to get them back to the original non-squared scale at first. The first 3 observations imply a very plain model y = 1 * x + 0. Then I compare it with the model y = 2*x using residuals

> tibble(x=1:4, y=c(1,2,3,8)) %>% 
+     {plot(.$x, .$y); .} %>% 
+     mutate(base_pred=x * 1) %>% 
+     mutate(outl_pred=x * 2) %>% 
+     mutate(across(ends_with('pred'), ~abs(. - y), 
        .names='{str_remove(col, "_pred")}_resi')) %>% 
+     print() %>% 
+     rename_with(~str_remove(., '_resi')) %>% 
+     summarise(across(c(base, outl), list(
+         mae=~mean(.),
+         rmse=~sqrt(mean(. ^ 2))))) %>% 
+     select(ends_with('mae'), everything())

      x     y base_pred outl_pred base_resi outl_resi
  <int> <dbl>     <dbl>     <dbl>     <dbl>     <dbl>
1     1     1         1         2         0         1
2     2     2         2         4         0         2
3     3     3         3         6         0         3
4     4     8         4         8         4         0

  base_mae outl_mae base_rmse outl_rmse
     <dbl>    <dbl>     <dbl>     <dbl>
1        1      1.5         2      1.87

You may see that base_model is better if you use MAE. Otherwise y=x*2 gives you better metric with RMSE because it suffers more and is more focused on outliers.

added 184 characters in body
Source Link

I assume this is more reasonable to talk about error vectors not matrices in most cases. You have a vector is errors, only one column.

The parameters "m" and "c" in iyour example depends on the errors. Eventually they'll be picked in a way minimizing your cost function. They'll be different for MSE and MAE. The first one will try to make a mistake on outliers better.

Here I'm talking mostly about cost function but expect something similar for them in role of metrics as well. (I'm thinking about the visualization now, the answer will be updated)

I assume this is more reasonable to talk about error vectors not matrices in most cases. You have a vector is errors, only one column.

The parameters "m" and "c" in iyour example depends on the errors. Eventually they'll be picked in a way minimizing your cost function. They'll be different for MSE and MAE. The first one will try to make a mistake on outliers better.

Here I'm talking mostly about cost function but expect something similar for them in role of metrics as well. (I'm thinking about the visualization now, the answer will be updated)

Source Link

I assume this is more reasonable to talk about error vectors not matrices in most cases. You have a vector is errors, only one column.

The parameters "m" and "c" in iyour example depends on the errors. Eventually they'll be picked in a way minimizing your cost function. They'll be different for MSE and MAE. The first one will try to make a mistake on outliers better.