fix link
Source Link
Martin Thoma
  • 19.2k
  • 36
  • 95
  • 170

Tensorflow, Keras, MXNet, PyTorch

If the neural network is given as a Tensorflow graph, then you can visualize this graph with TensorBoard: https://www.tensorflow.org/versions/r0.9/how_tos/graph_viz/index.htmlvisualize this graph with TensorBoard.

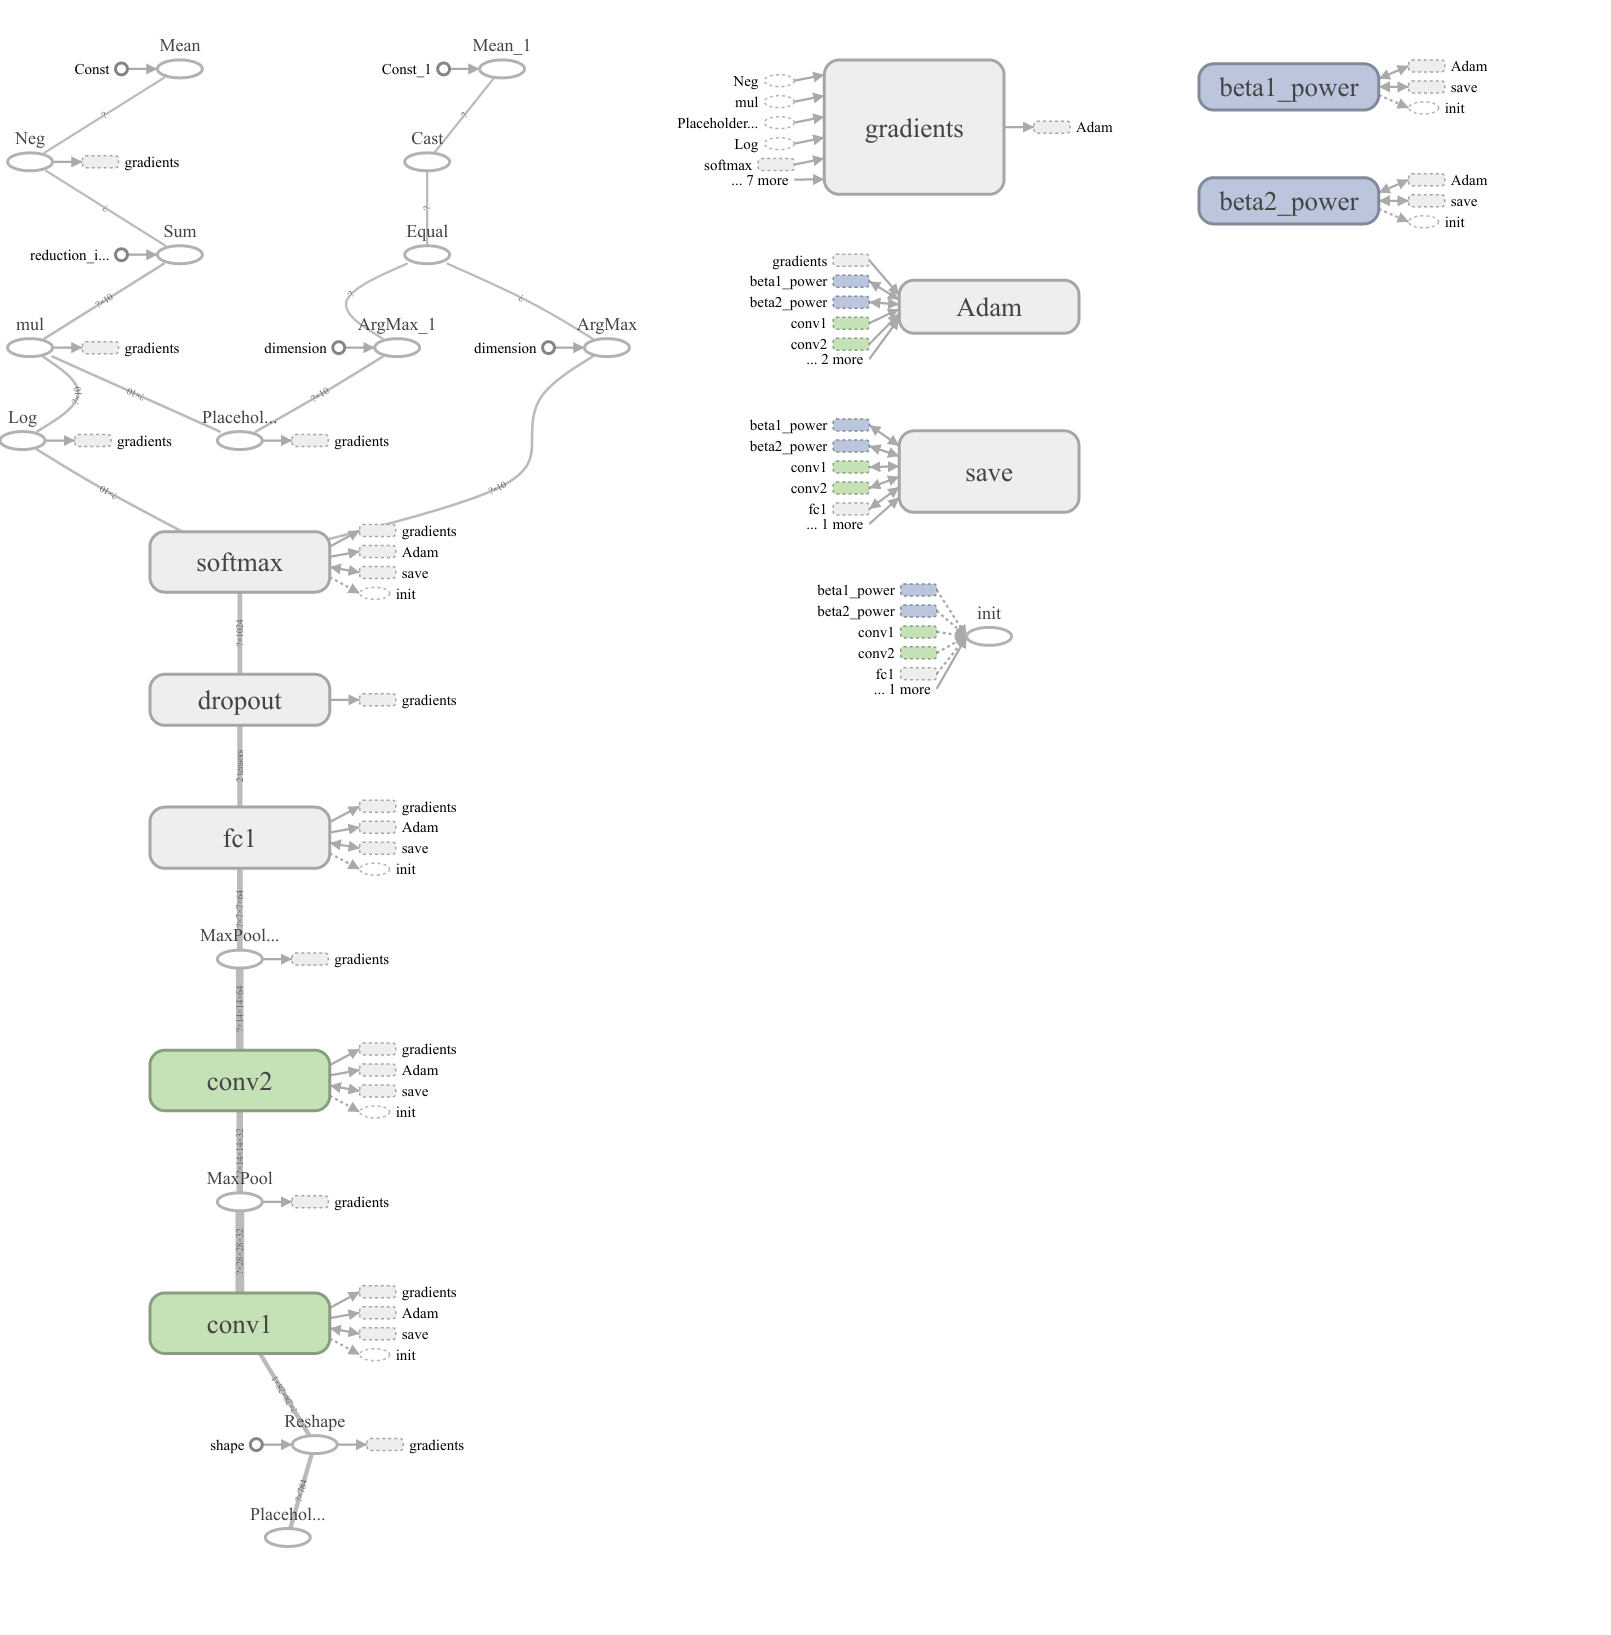
Here is how the MNIST CNN looks like:

enter image description here

You can add names / scopes (like "dropout", "softmax", "fc1", "conv1", "conv2") yourself.

Interpretation

The following is only about the left graph. I ignore the 4 small graphs on the right half.

Each box is a layer with parameters that can be learned. For inference, information flows from bottom to the top. Ellipses are layers which do not contain learned parameters.

The color of the boxes does not have a meaning.

I'm not sure of the value of the dashed small boxes ("gradients", "Adam", "save").

Tensorflow, Keras, MXNet, PyTorch

If the neural network is given as a Tensorflow graph, then you can visualize this graph with TensorBoard: https://www.tensorflow.org/versions/r0.9/how_tos/graph_viz/index.html

Here is how the MNIST CNN looks like:

enter image description here

You can add names / scopes (like "dropout", "softmax", "fc1", "conv1", "conv2") yourself.

Interpretation

The following is only about the left graph. I ignore the 4 small graphs on the right half.

Each box is a layer with parameters that can be learned. For inference, information flows from bottom to the top. Ellipses are layers which do not contain learned parameters.

The color of the boxes does not have a meaning.

I'm not sure of the value of the dashed small boxes ("gradients", "Adam", "save").
Tensorflow, Keras, MXNet, PyTorch

If the neural network is given as a Tensorflow graph, then you can visualize this graph with TensorBoard.

Here is how the MNIST CNN looks like:

enter image description here

You can add names / scopes (like "dropout", "softmax", "fc1", "conv1", "conv2") yourself.

Interpretation

The following is only about the left graph. I ignore the 4 small graphs on the right half.

Each box is a layer with parameters that can be learned. For inference, information flows from bottom to the top. Ellipses are layers which do not contain learned parameters.

The color of the boxes does not have a meaning.

I'm not sure of the value of the dashed small boxes ("gradients", "Adam", "save").

added 23 characters in body
Source Link
Martin Thoma
  • 19.2k
  • 36
  • 95
  • 170

Tensorflow, Keras, MXNet, PyTorch

If the neural network is given as a Tensorflow graph, then you can visualize this graph with TensorBoard: https://www.tensorflow.org/versions/r0.9/how_tos/graph_viz/index.html

Here is how the MNIST CNN looks like:

enter image description here

You can add names / scopes (like "dropout", "softmax", "fc1", "conv1", "conv2") yourself.

Interpretation

The following is only about the left graph. I ignore the 4 small graphs on the right half.

Each box is a layer with parameters that can be learned. For inference, information flows from bottom to the top. Ellipses are layers which do not contain learned parameters.

The color of the boxes does not have a meaning.

I'm not sure of the value of the dashed small boxes ("gradients", "Adam", "save").

Tensorflow

If the neural network is given as a Tensorflow graph, then you can visualize this graph with TensorBoard: https://www.tensorflow.org/versions/r0.9/how_tos/graph_viz/index.html

Here is how the MNIST CNN looks like:

enter image description here

You can add names / scopes (like "dropout", "softmax", "fc1", "conv1", "conv2") yourself.

Interpretation

The following is only about the left graph. I ignore the 4 small graphs on the right half.

Each box is a layer with parameters that can be learned. For inference, information flows from bottom to the top. Ellipses are layers which do not contain learned parameters.

The color of the boxes does not have a meaning.

I'm not sure of the value of the dashed small boxes ("gradients", "Adam", "save").

Tensorflow, Keras, MXNet, PyTorch

If the neural network is given as a Tensorflow graph, then you can visualize this graph with TensorBoard: https://www.tensorflow.org/versions/r0.9/how_tos/graph_viz/index.html

Here is how the MNIST CNN looks like:

enter image description here

You can add names / scopes (like "dropout", "softmax", "fc1", "conv1", "conv2") yourself.

Interpretation

The following is only about the left graph. I ignore the 4 small graphs on the right half.

Each box is a layer with parameters that can be learned. For inference, information flows from bottom to the top. Ellipses are layers which do not contain learned parameters.

The color of the boxes does not have a meaning.

I'm not sure of the value of the dashed small boxes ("gradients", "Adam", "save").

added 94 characters in body
Source Link
Martin Thoma
  • 19.2k
  • 36
  • 95
  • 170

Tensorflow

If the neural network is given as a Tensorflow graph, then you can visualize this graph with TensorBoard: https://www.tensorflow.org/versions/r0.9/how_tos/graph_viz/index.html

Here is how the MNIST CNN looks like:

enter image description here

You can add names / scopes (like "dropout", "softmax", "fc1", "conv1", "conv2") yourself.

Interpretation

The following is only about the left graph. I ignore the 4 small graphs on the right half.

Each box is a layer with parameters that can be learned. For inference, information flows from bottom to the top. Ellipses are layers which do not contain learned parameters.

The color of the boxes does not have a meaning.

I'm not sure of the value of the dashed small boxes ("gradients", "Adam", "save").

Tensorflow

If the neural network is given as a Tensorflow graph, then you can visualize this graph with TensorBoard: https://www.tensorflow.org/versions/r0.9/how_tos/graph_viz/index.html

Here is how the MNIST CNN looks like:

enter image description here

You can add names / scopes (like "dropout", "softmax", "fc1", "conv1", "conv2") yourself.

Interpretation

The following is only about the left graph. I ignore the 4 small graphs on the right half.

Each box is a layer with parameters that can be learned. For inference, information flows from bottom to the top. Ellipses are layers which do not contain learned parameters.

The color of the boxes does not have a meaning.

I'm not sure of the value of the dashed small boxes ("gradients", "Adam", "save").

added 286 characters in body
Source Link
Martin Thoma
  • 19.2k
  • 36
  • 95
  • 170
Loading
added 225 characters in body
Source Link
Martin Thoma
  • 19.2k
  • 36
  • 95
  • 170
Loading
Source Link
Martin Thoma
  • 19.2k
  • 36
  • 95
  • 170
Loading