I have a .csv file with data in the following form:
moment_1;moment_2;moment_3;force_x;force_y;force_z;...
-0,02131267;-1,6032766088;5,9906811787;5,40010285;0,0203;86,44227467;...
2599;-1,70091039344;-1,3044809;-0,0406673590;-2,60896180797;43,2334;...
moment_1;moment_2;moment_3;force_x;force_y;force_z;...
-0,02131267;-1,6032766088;5,9906811787;5,40010285;0,0203;86,44227467;...
2599;-1,70091039344;-1,3044809;-0,0406673590;-2,60896180797;43,2334;...
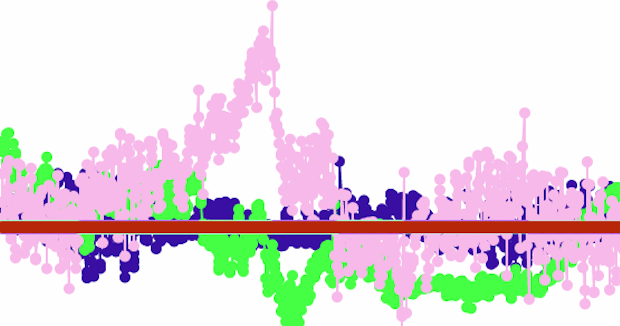
The file is very large and I need to put it in an interactive visualization, that's why I need to reduce the data points without changing the overall structure too much. Many
Many data points are very close to each other as seen in the following image:
My approach was to define a threshold and filter all points which have a distance to the previous point lower than the threshold. But But I think that's not an optimal solution because, when I remove one index, I need to remove it from the other data array too, otherwise the structure is changed. Before I'm doing this I'm here to ask for a
Are there better approach.approaches?

