added 381 characters in body
Source Link
Aditya
  • 2.5k
  • 2
  • 17
  • 35

Here we have 5000050000 points, 1000010000 in each of fivefive categories with associated numerical values.

Instead of using Logarithms, you can also use O( log* N ) is "iterated logarithm":

In computer science, the iterated logarithm of n, written log* n (usually read "log star"), is the number of times the logarithm function must be iteratively applied before the result is less than or equal to 1.

Checkout DatashaderDatashader (This is what you Need)

Reference Notebook

Generating Something Random(you will get the idea)

import pandas as pd
import numpy as np

np.random.seed(1)
num=10000

dists = {cat: pd.DataFrame(dict(x=np.random.normal(x,s,num),
                                y=np.random.normal(y,s,num),
                                val=val,cat=cat))
         for x,y,s,val,cat in 
         [(2,2,0.01,10,"d1"), (2,-2,0.1,20,"d2"), (-2,-2,0.5,30,"d3"), (-2,2,1.0,40,"d4"), (0,0,3,50,"d5")]}

df = pd.concat(dists,ignore_index=True)
df["cat"]=df["cat"].astype("category")
df.tail()
        cat val     x           y
49995   d5  50  -1.397579   0.610189
49996   d5  50  -2.649610   3.080821
49997   d5  50  1.933360    0.243676
49998   d5  50  4.306374    1.032139
49999   d5  50  -0.493567   -2.242669
%time tf.shade(ds.Canvas().points(df,'x','y'))

Output Image

The Picture Clearly Shows 5 Normal Distributions

Here we have 50000 points, 10000 in each of five categories with associated numerical values.

Checkout Datashader (This is what you Need)

Reference Notebook

Generating Something Random(you will get the idea)

import pandas as pd
import numpy as np

np.random.seed(1)
num=10000

dists = {cat: pd.DataFrame(dict(x=np.random.normal(x,s,num),
                                y=np.random.normal(y,s,num),
                                val=val,cat=cat))
         for x,y,s,val,cat in 
         [(2,2,0.01,10,"d1"), (2,-2,0.1,20,"d2"), (-2,-2,0.5,30,"d3"), (-2,2,1.0,40,"d4"), (0,0,3,50,"d5")]}

df = pd.concat(dists,ignore_index=True)
df["cat"]=df["cat"].astype("category")
df.tail()
        cat val     x           y
49995   d5  50  -1.397579   0.610189
49996   d5  50  -2.649610   3.080821
49997   d5  50  1.933360    0.243676
49998   d5  50  4.306374    1.032139
49999   d5  50  -0.493567   -2.242669
%time tf.shade(ds.Canvas().points(df,'x','y'))

Output Image
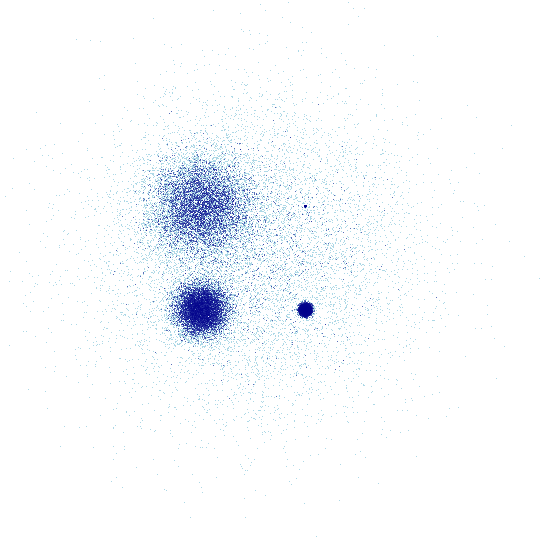
The Picture Clearly Shows 5 Normal Distributions

Here we have 50000 points, 10000 in each of five categories with associated numerical values.

Instead of using Logarithms, you can also use O( log* N ) is "iterated logarithm":

In computer science, the iterated logarithm of n, written log* n (usually read "log star"), is the number of times the logarithm function must be iteratively applied before the result is less than or equal to 1.

Checkout Datashader (This is what you Need)

Reference Notebook

Generating Something Random(you will get the idea)

import pandas as pd
import numpy as np

np.random.seed(1)
num=10000

dists = {cat: pd.DataFrame(dict(x=np.random.normal(x,s,num),
                                y=np.random.normal(y,s,num),
                                val=val,cat=cat))
         for x,y,s,val,cat in 
         [(2,2,0.01,10,"d1"), (2,-2,0.1,20,"d2"), (-2,-2,0.5,30,"d3"), (-2,2,1.0,40,"d4"), (0,0,3,50,"d5")]}

df = pd.concat(dists,ignore_index=True)
df["cat"]=df["cat"].astype("category")
df.tail()
        cat val     x           y
49995   d5  50  -1.397579   0.610189
49996   d5  50  -2.649610   3.080821
49997   d5  50  1.933360    0.243676
49998   d5  50  4.306374    1.032139
49999   d5  50  -0.493567   -2.242669
%time tf.shade(ds.Canvas().points(df,'x','y'))

Output Image

The Picture Clearly Shows 5 Normal Distributions

Source Link
Aditya
  • 2.5k
  • 2
  • 17
  • 35

Here we have 50000 points, 10000 in each of five categories with associated numerical values.

Checkout Datashader (This is what you Need)

Reference Notebook

Generating Something Random(you will get the idea)

import pandas as pd
import numpy as np

np.random.seed(1)
num=10000

dists = {cat: pd.DataFrame(dict(x=np.random.normal(x,s,num),
                                y=np.random.normal(y,s,num),
                                val=val,cat=cat))
         for x,y,s,val,cat in 
         [(2,2,0.01,10,"d1"), (2,-2,0.1,20,"d2"), (-2,-2,0.5,30,"d3"), (-2,2,1.0,40,"d4"), (0,0,3,50,"d5")]}

df = pd.concat(dists,ignore_index=True)
df["cat"]=df["cat"].astype("category")
df.tail()
        cat val     x           y
49995   d5  50  -1.397579   0.610189
49996   d5  50  -2.649610   3.080821
49997   d5  50  1.933360    0.243676
49998   d5  50  4.306374    1.032139
49999   d5  50  -0.493567   -2.242669
%time tf.shade(ds.Canvas().points(df,'x','y'))

Output Image

The Picture Clearly Shows 5 Normal Distributions