Wording improved
Source Link
Esmailian
  • 9.4k
  • 2
  • 32
  • 48

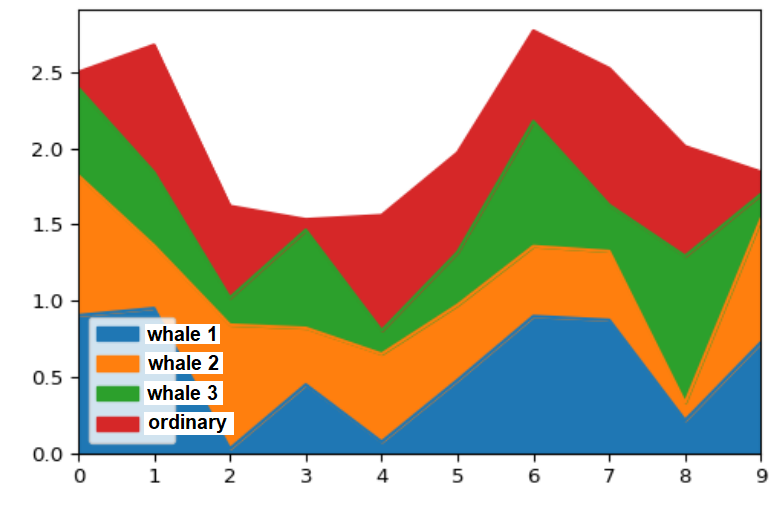
To visualize change in the size of multiple entities that are contributing to a total through time, e.g. total (t) = book_1 (t) + book_2 (t) + ..., youwe can use Stacked Area Plot. This plot can be used for normalized and un-normalized (absolute) values.
Preprocessing

  1. For large number of entities, to avoid cognitive load, we can keep only those entities that become significant (whale) at some point in the plot, and group all the others under an "ordinary" entity, this. This way, cognitive load is minimized and only those entities that matter at some point are distinguished. For example, distinguishing books that have more than 10% of traffic at some point in the plotted time span.

  2. If total fluctuation is very high, logarithm of values can be plugged into the plot.

To visualize change in the size of multiple entities that are contributing to a total through time, e.g. total (t) = book_1 (t) + book_2 (t) + ..., you can use Stacked Area Plot. This plot can be used for normalized and un-normalized (absolute) values.

Preprocessing

  1. For large number of entities, to avoid cognitive load, we can keep only those entities that become significant (whale) some point in the plot, and group all the others under an "ordinary" entity, this way cognitive load is minimized and only those entities that matter at some point are distinguished. For example, distinguishing books that have more than 10% of traffic some point in the plotted time span.

  2. If total fluctuation is very high, logarithm of values can be plugged into the plot.

To visualize change in the size of multiple entities that are contributing to a total through time, e.g. total (t) = book_1 (t) + book_2 (t) + ..., we can use Stacked Area Plot. This plot can be used for normalized and un-normalized (absolute) values.

Preprocessing

  1. For large number of entities, to avoid cognitive load, we can keep only those entities that become significant (whale) at some point in the plot, and group all the others under an "ordinary" entity. This way, cognitive load is minimized and only those entities that matter at some point are distinguished. For example, distinguishing books that have more than 10% of traffic at some point in the plotted time span.

  2. If total fluctuation is very high, logarithm of values can be plugged into the plot.

Image updated
Source Link
Esmailian
  • 9.4k
  • 2
  • 32
  • 48

To visualize change in the size of multiple entities that are contributing to a total through time, e.g. total (t) = book_1 (t) + book_2 (t) + ..., you can use Stacked Area Plot. This plot can be used for normalized and un-normalized (absolute) values.

Preprocessing

  1. For large number of entities, to avoid cognitive load, we can keep only those entities that become significant (whale) some point in the plot, and group all the others under an "ordinary" entity, this way cognitive load is minimized and only those entities that matter at some point are distinguished. For example, distinguishing books that have more than 10% of traffic some point in the plotted time span.

  2. If total fluctuation is very high, logarithm of values can be plugged into the plot.

Wording improved
Source Link
Esmailian
  • 9.4k
  • 2
  • 32
  • 48

To visualize change in the size of multiple entities that are contributing to a total through time, e.g. total (t) = book_1 (t) + book_2 (t) + ..., you can use Stacked Area Plot. This plot can be used for normalized and un-normalized (absolute) values.

Preprocessing

  1. For large number of entities, to avoid cognitive load, we can keep only those entities that become significant (whale) some point in the plot, and group all the others under an "ordinary" entity, this way cognitive load is minimized and only those entities that matter at some point are distinguished. For example, only keepingdistinguishing books that have more than 10% of traffic some point in the plotted time span.

  2. If total fluctuation is very high, logarithm of values can be plugged into the plot.

To visualize change in the size of multiple entities that are contributing to a total through time, e.g. total (t) = book_1 (t) + book_2 (t) + ..., you can use Stacked Area Plot. This plot can be used for normalized and un-normalized (absolute) values.

Preprocessing

  1. For large number of entities, to avoid cognitive load, we can keep only those entities that become significant (whale) some point in the plot, and group all the others under an "ordinary" entity, this way cognitive load is minimized and only those entities that matter at some point are distinguished. For example, only keeping books that have more than 10% of traffic some point in the plotted time span.

  2. If total fluctuation is very high, logarithm of values can be plugged into the plot.

To visualize change in the size of multiple entities that are contributing to a total through time, e.g. total (t) = book_1 (t) + book_2 (t) + ..., you can use Stacked Area Plot. This plot can be used for normalized and un-normalized (absolute) values.

Preprocessing

  1. For large number of entities, to avoid cognitive load, we can keep only those entities that become significant (whale) some point in the plot, and group all the others under an "ordinary" entity, this way cognitive load is minimized and only those entities that matter at some point are distinguished. For example, distinguishing books that have more than 10% of traffic some point in the plotted time span.

  2. If total fluctuation is very high, logarithm of values can be plugged into the plot.

Explanation improved
Source Link
Esmailian
  • 9.4k
  • 2
  • 32
  • 48
Loading
Wording improved
Source Link
Esmailian
  • 9.4k
  • 2
  • 32
  • 48
Loading
Source Link
Esmailian
  • 9.4k
  • 2
  • 32
  • 48
Loading