added 145 characters in body
Source Link
Alex
  • 101
  • 2

You can do this in python with the seaborn visualization library (built on top of matplotlib).

data = [
  ['Banana', 'Water', 'Rice'],
  ['Rice', 'Water'],
  ['Bread', 'Banana', 'Juice'],
]

# Pull out combinations
from itertools import combinations
data_pairs = []
for d in data:
    data_pairs += [list(sorted(x)) + [1] for x in combinations(d, 2)]
    # Add reverse as well (this will mirror the heatmap)
    data_pairs += [list(sorted(x))[::-1] + [1] for x in combinations(d, 2)]

# Shape into dataframe
import pandas as pd
df = pd.DataFrame(data_pairs)
df_zeros = pd.DataFrame([list(x) + [0] for x in combinations(df[[0, 1]].values.flatten(), 2)])
df = pd.concat((df, df_zeros))
df = df.groupby([0, 1])[2].sum().reset_index().pivot(0, 1, 2).fillna(0)

import seaborn as sns
from matplotlib.pyplot import plt
sns.heatmap(df, cmap='YlGnBu')
plt.show()

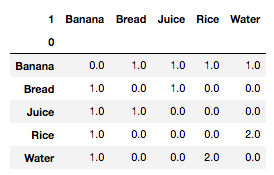
The final dataframe df looks like this:

enter image description hereenter image description here

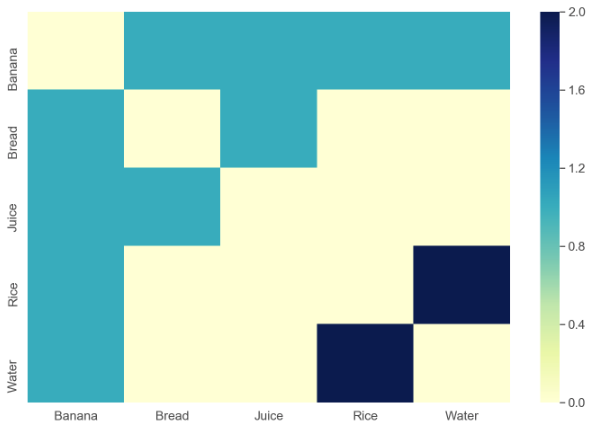
and the resulting visualization is:

enter image description hereenter image description here

You can do this with the seaborn visualization library (built on top of matplotlib).

data = [
  ['Banana', 'Water', 'Rice'],
  ['Rice', 'Water'],
  ['Bread', 'Banana', 'Juice'],
]

# Pull out combinations
from itertools import combinations
data_pairs = []
for d in data:
    data_pairs += [list(sorted(x)) + [1] for x in combinations(d, 2)]

# Shape into dataframe
import pandas as pd
df = pd.DataFrame(data_pairs)
df_zeros = pd.DataFrame([list(x) + [0] for x in combinations(df[[0, 1]].values.flatten(), 2)])
df = pd.concat((df, df_zeros))
df = df.groupby([0, 1])[2].sum().reset_index().pivot(0, 1, 2)

import seaborn as sns
from matplotlib.pyplot import plt
sns.heatmap(df, cmap='YlGnBu')
plt.show()

The final dataframe df looks like this:

enter image description here

and the resulting visualization is:
enter image description here

You can do this in python with the seaborn visualization library (built on top of matplotlib).

data = [
  ['Banana', 'Water', 'Rice'],
  ['Rice', 'Water'],
  ['Bread', 'Banana', 'Juice'],
]

# Pull out combinations
from itertools import combinations
data_pairs = []
for d in data:
    data_pairs += [list(sorted(x)) + [1] for x in combinations(d, 2)]
    # Add reverse as well (this will mirror the heatmap)
    data_pairs += [list(sorted(x))[::-1] + [1] for x in combinations(d, 2)]

# Shape into dataframe
import pandas as pd
df = pd.DataFrame(data_pairs)
df_zeros = pd.DataFrame([list(x) + [0] for x in combinations(df[[0, 1]].values.flatten(), 2)])
df = pd.concat((df, df_zeros))
df = df.groupby([0, 1])[2].sum().reset_index().pivot(0, 1, 2).fillna(0)

import seaborn as sns
from matplotlib.pyplot import plt
sns.heatmap(df, cmap='YlGnBu')
plt.show()

The final dataframe df looks like this:

enter image description here

and the resulting visualization is:

enter image description here

Source Link
Alex
  • 101
  • 2

You can do this with the seaborn visualization library (built on top of matplotlib).

data = [
  ['Banana', 'Water', 'Rice'],
  ['Rice', 'Water'],
  ['Bread', 'Banana', 'Juice'],
]

# Pull out combinations
from itertools import combinations
data_pairs = []
for d in data:
    data_pairs += [list(sorted(x)) + [1] for x in combinations(d, 2)]

# Shape into dataframe
import pandas as pd
df = pd.DataFrame(data_pairs)
df_zeros = pd.DataFrame([list(x) + [0] for x in combinations(df[[0, 1]].values.flatten(), 2)])
df = pd.concat((df, df_zeros))
df = df.groupby([0, 1])[2].sum().reset_index().pivot(0, 1, 2)

import seaborn as sns
from matplotlib.pyplot import plt
sns.heatmap(df, cmap='YlGnBu')
plt.show()

The final dataframe df looks like this:

enter image description here

and the resulting visualization is:

enter image description here