Rollback to Revision 1
Source Link
Stephen Rauch
  • 1.8k
  • 11
  • 22
  • 34

Deleted question Time series clustering using dynamic time warping and agglomerative clustering

Deleted questionI'm new to data science and I'm currently working on a project to classify electricity consumption profiles.

This consists of electricity meter readings taken from sites on a half-hourly interval over a year (17520 readings in total). I am using Python to analyse the data.

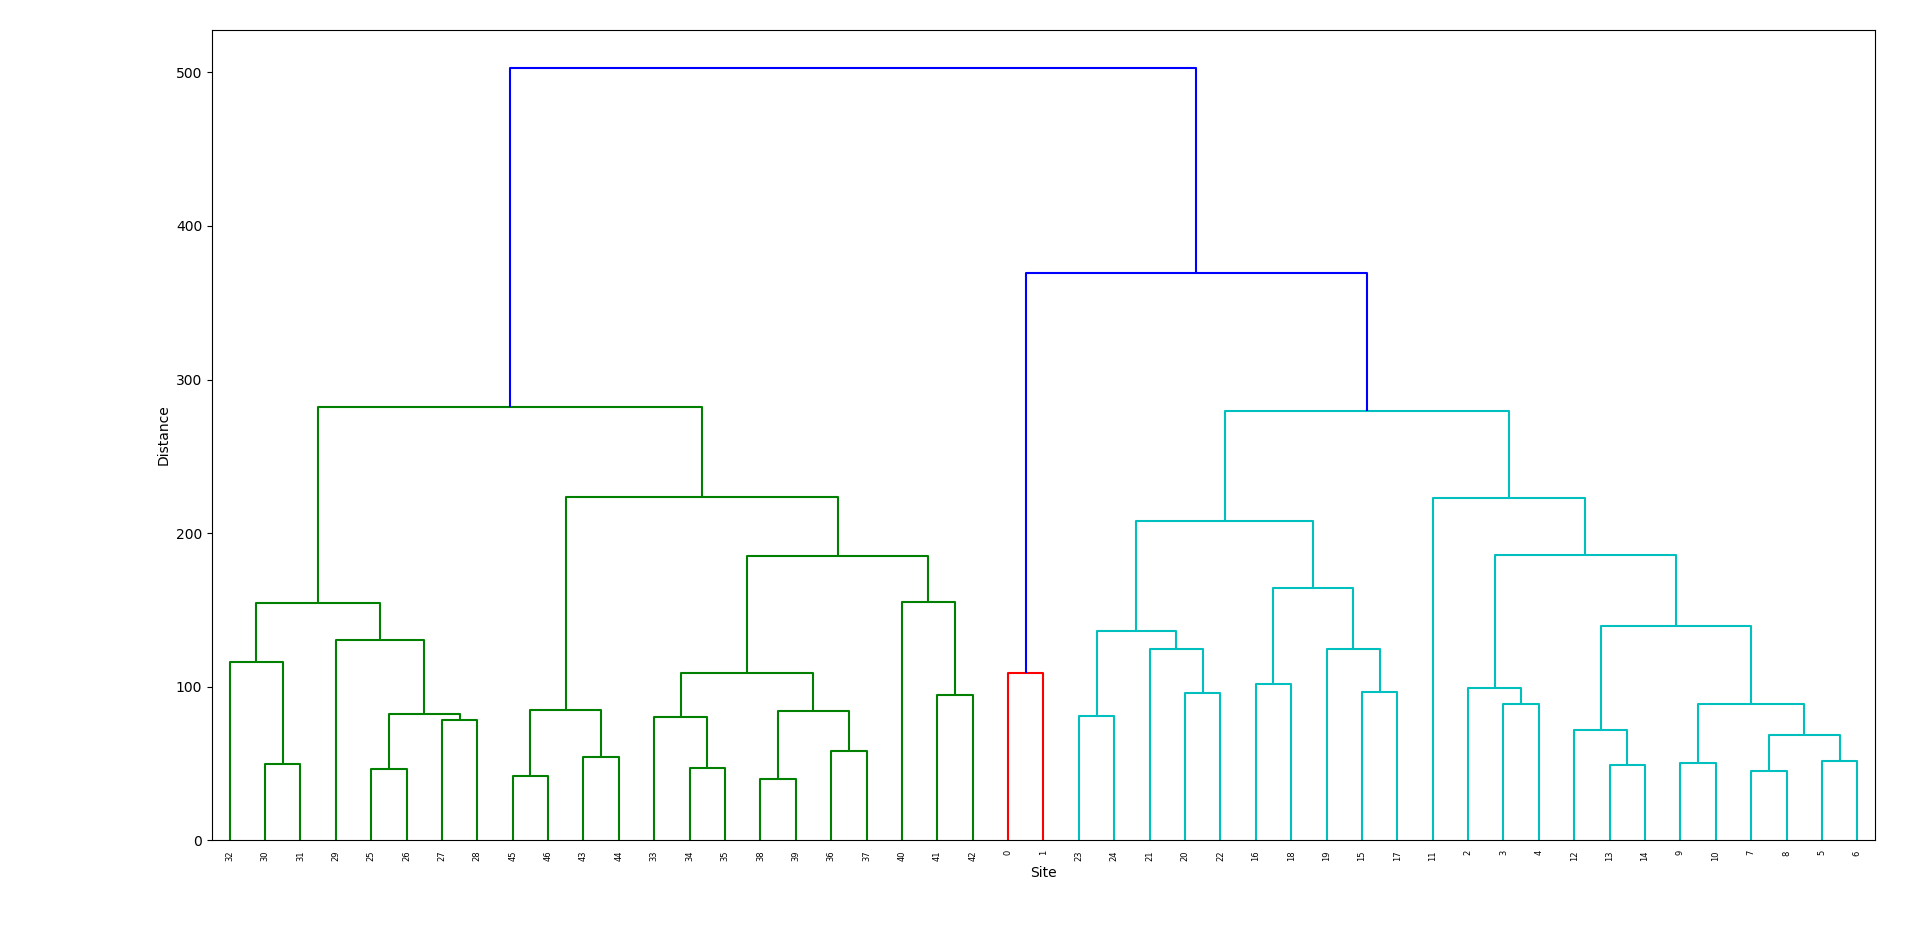
I have settled on the current process of z-normalising the data, applying dynamic time warping on the entire dataset (using DTAIDistance) and then using agglomerative clustering as suggested by answers to similar questions on the site. I have deleted my StackExchange accountproduced the dendrogram below using 'complete' linkage using scipy.

Dendrogram

I have some questions regarding the process.

  1. What is the "best"* metric to determine the quality of clustering (i.e. where do I set the cut off on my dendrogram?) and is there any iterative method to determine the "optimal" cut off? (* I am aware that "best" is quite subjective for this type of clustering)
  2. Following up on 1. - say if I want to produce an elbow plot from my DTW distance matrix. How would I go about doing this in Python?
  3. How can I find out if I have selected the correct linkage method? I have discounted Ward linkage as it apparently relies on an Euclidean distance matrix and have plotted dendrogram using other linkage methods, but I am unsure as to assess their suitability for my dataset.
  4. I have read that z-normalising data is required for most applications of DTW - when is z-normalising not required for DTW?
  5. Are any other clustering methods I should consider?

Deleted question

Deleted question as I have deleted my StackExchange account

Time series clustering using dynamic time warping and agglomerative clustering

I'm new to data science and I'm currently working on a project to classify electricity consumption profiles.

This consists of electricity meter readings taken from sites on a half-hourly interval over a year (17520 readings in total). I am using Python to analyse the data.

I have settled on the current process of z-normalising the data, applying dynamic time warping on the entire dataset (using DTAIDistance) and then using agglomerative clustering as suggested by answers to similar questions on the site. I have produced the dendrogram below using 'complete' linkage using scipy.

Dendrogram

I have some questions regarding the process.

  1. What is the "best"* metric to determine the quality of clustering (i.e. where do I set the cut off on my dendrogram?) and is there any iterative method to determine the "optimal" cut off? (* I am aware that "best" is quite subjective for this type of clustering)
  2. Following up on 1. - say if I want to produce an elbow plot from my DTW distance matrix. How would I go about doing this in Python?
  3. How can I find out if I have selected the correct linkage method? I have discounted Ward linkage as it apparently relies on an Euclidean distance matrix and have plotted dendrogram using other linkage methods, but I am unsure as to assess their suitability for my dataset.
  4. I have read that z-normalising data is required for most applications of DTW - when is z-normalising not required for DTW?
  5. Are any other clustering methods I should consider?
deleted 1702 characters in body; edited tags; edited title
Source Link
user79845
user79845

Time series clustering using dynamic time warping and agglomerative clustering Deleted question

I'm new to data science and I'm currently working on a project to classify electricity consumption profiles.

This consists of electricity meter readings taken from sites on a half-hourly interval over a year (17520 readings in total). I am using Python to analyse the data.

I have settled on the current process of z-normalising the data, applying dynamic time warping on the entire dataset (using DTAIDistance) and then using agglomerative clusteringDeleted question as suggested by answers to similar questions on the site. I have produced the dendrogram below using 'complete' linkage using scipy.

Dendrogram

I have some questions regarding the process.deleted my StackExchange account

  1. What is the "best"* metric to determine the quality of clustering (i.e. where do I set the cut off on my dendrogram?) and is there any iterative method to determine the "optimal" cut off? (* I am aware that "best" is quite subjective for this type of clustering)
  2. Following up on 1. - say if I want to produce an elbow plot from my DTW distance matrix. How would I go about doing this in Python?
  3. How can I find out if I have selected the correct linkage method? I have discounted Ward linkage as it apparently relies on an Euclidean distance matrix and have plotted dendrogram using other linkage methods, but I am unsure as to assess their suitability for my dataset.
  4. I have read that z-normalising data is required for most applications of DTW - when is z-normalising not required for DTW?
  5. Are any other clustering methods I should consider?

Time series clustering using dynamic time warping and agglomerative clustering

I'm new to data science and I'm currently working on a project to classify electricity consumption profiles.

This consists of electricity meter readings taken from sites on a half-hourly interval over a year (17520 readings in total). I am using Python to analyse the data.

I have settled on the current process of z-normalising the data, applying dynamic time warping on the entire dataset (using DTAIDistance) and then using agglomerative clustering as suggested by answers to similar questions on the site. I have produced the dendrogram below using 'complete' linkage using scipy.

Dendrogram

I have some questions regarding the process.

  1. What is the "best"* metric to determine the quality of clustering (i.e. where do I set the cut off on my dendrogram?) and is there any iterative method to determine the "optimal" cut off? (* I am aware that "best" is quite subjective for this type of clustering)
  2. Following up on 1. - say if I want to produce an elbow plot from my DTW distance matrix. How would I go about doing this in Python?
  3. How can I find out if I have selected the correct linkage method? I have discounted Ward linkage as it apparently relies on an Euclidean distance matrix and have plotted dendrogram using other linkage methods, but I am unsure as to assess their suitability for my dataset.
  4. I have read that z-normalising data is required for most applications of DTW - when is z-normalising not required for DTW?
  5. Are any other clustering methods I should consider?

Deleted question

Deleted question as I have deleted my StackExchange account

Source Link
user79845
user79845

Time series clustering using dynamic time warping and agglomerative clustering

I'm new to data science and I'm currently working on a project to classify electricity consumption profiles.

This consists of electricity meter readings taken from sites on a half-hourly interval over a year (17520 readings in total). I am using Python to analyse the data.

I have settled on the current process of z-normalising the data, applying dynamic time warping on the entire dataset (using DTAIDistance) and then using agglomerative clustering as suggested by answers to similar questions on the site. I have produced the dendrogram below using 'complete' linkage using scipy.

Dendrogram

I have some questions regarding the process.

  1. What is the "best"* metric to determine the quality of clustering (i.e. where do I set the cut off on my dendrogram?) and is there any iterative method to determine the "optimal" cut off? (* I am aware that "best" is quite subjective for this type of clustering)
  2. Following up on 1. - say if I want to produce an elbow plot from my DTW distance matrix. How would I go about doing this in Python?
  3. How can I find out if I have selected the correct linkage method? I have discounted Ward linkage as it apparently relies on an Euclidean distance matrix and have plotted dendrogram using other linkage methods, but I am unsure as to assess their suitability for my dataset.
  4. I have read that z-normalising data is required for most applications of DTW - when is z-normalising not required for DTW?
  5. Are any other clustering methods I should consider?