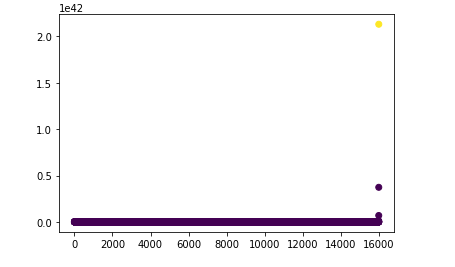
K-means anomaly detection scatter plot
The following code, takes a single column from a dataset and then adds 50 anomalies to the dataset that is quite bigger than the maximum values of the dataset.
import pandas as pd
import numpy as np
import pandas as pd
from sklearn.cluster import KMeans
import matplotlib.pyplot as plt
import seaborn as sns

X=pd.read_csv('C:/Files/dataset.csv’csv', sep=';', encoding='latin1' )

#Adding the anomalies

for i in range(0, 50):
    X.append(X.my_column.max() * (10 + pd.np.abs(pd.np.random.normal())))
X = pd.np.array(X)

clf = KMeans(n_clusters=2, init='k-means++', max_iter=300, n_init=10, random_state=1)
clf.fit(X.my_column.values.reshape(-1, 1))
X_prd = clf.predict(X.my_column.values.reshape(-1, 1))

plt.scatter(X.index, X.my_column, c=X_prd)
The picture bellow shows the results and I was expecting outlier cluster to be clear compared the normal data.
Why so ?
Because for creating the anomalies I took the maximum value of my_column which was 9689.
I am stuck here and I don’t know where to do from here, so I would appreciate some help.
The goal is that K mean to detected these added anomalies.

