Became Hot Network Question
added 9 characters in body
Source Link
Tlaloc-ES
  • 337
  • 1
  • 7

I read about the validation_curve and how interpret it to know if there are over-fitting or underfitting, but how can interpret the plot when the data is the error like this:

enter image description here

The X-axis is "Nº of examples of training" Redline is train error Green line is validation error

  • The X-axis is "Nº of examples of training"
  • Redline is train error
  • Green line is validation error

Thanks
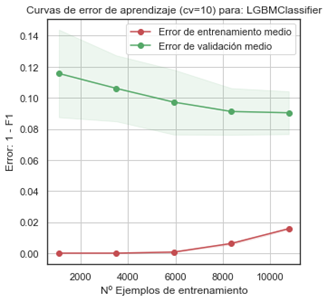
I read about the validation_curve and how interpret it to know if there are over-fitting or underfitting, but how can interpret the plot when the data is the error like this:

enter image description here

The X-axis is "Nº of examples of training" Redline is train error Green line is validation error

Thanks

I read about the validation_curve and how interpret it to know if there are over-fitting or underfitting, but how can interpret the plot when the data is the error like this:

enter image description here

  • The X-axis is "Nº of examples of training"
  • Redline is train error
  • Green line is validation error

Thanks

Source Link
Tlaloc-ES
  • 337
  • 1
  • 7

What is a good interpretation of this 'learning curve' plot?

I read about the validation_curve and how interpret it to know if there are over-fitting or underfitting, but how can interpret the plot when the data is the error like this:

enter image description here

The X-axis is "Nº of examples of training" Redline is train error Green line is validation error

Thanks