Post Closed as "Needs details or clarity" by Valentin Calomme, Peter, David Masip, fuwiak, 10xAI
added 357 characters in body; edited title
Source Link
Tlaloc-ES
  • 337
  • 1
  • 7

is it possible get a overfit underfit comparation between models, with this chart? (homework)

Hello I am triyingtrying to interpret this chart.

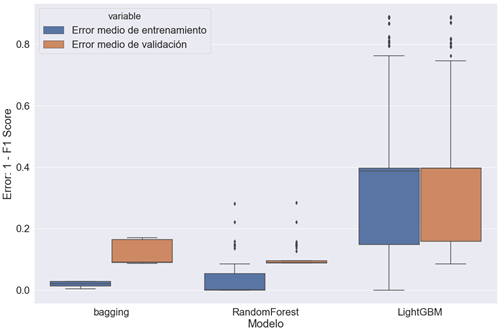
I am not sure how to interpret this, because, I think that the fact of the for examples LGBM Validation error, is wide and similar to train boxplot, there arent problem of overfitting, but when I see another type of charts of the execution of LGBM, I can see that really the LGBM is overfitted, so really I don't know how to interpret this of the correct way.

enter image description here

But I don't know how could interpret beyond this:

LightGBM is maybe the best option because it is faster and finally you can get enough accuracy with that, and in comparison with the other two, bagging have less overfit because of the differences between the error is less.

Any idea?

Thanks

is it possible get a overfit underfit comparation between models, with this chart?

Hello I am triying to interpret this chart

enter image description here

But I don't know how could interpret.

Any idea?

Thanks

is it possible get a overfit underfit comparation between models, with this chart? (homework)

I am trying to interpret this chart.

I am not sure how to interpret this, because, I think that the fact of the for examples LGBM Validation error, is wide and similar to train boxplot, there arent problem of overfitting, but when I see another type of charts of the execution of LGBM, I can see that really the LGBM is overfitted, so really I don't know how to interpret this of the correct way.

enter image description here

But I don't know how could interpret beyond this:

LightGBM is maybe the best option because it is faster and finally you can get enough accuracy with that, and in comparison with the other two, bagging have less overfit because of the differences between the error is less.

Any idea?

Thanks
edited title
Link
Tlaloc-ES
  • 337
  • 1
  • 7

How can I interpret is it possible get a overfit underfit comparation between models, with this box plot of errorschart?

Source Link
Tlaloc-ES
  • 337
  • 1
  • 7

How can I interpret this box plot of errors?

Hello I am triying to interpret this chart

enter image description here

But I don't know how could interpret.

Any idea?

Thanks