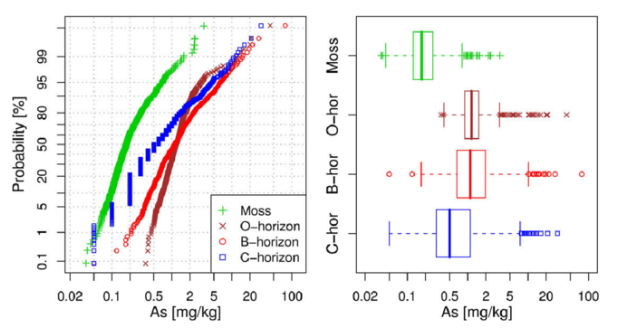
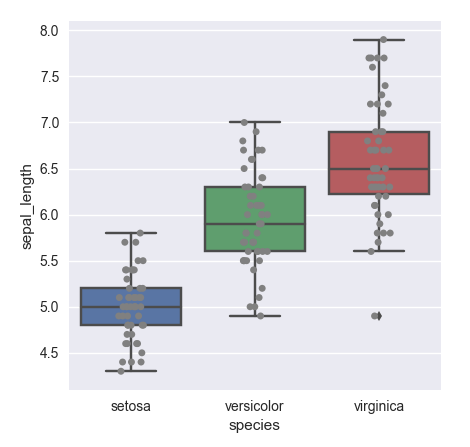
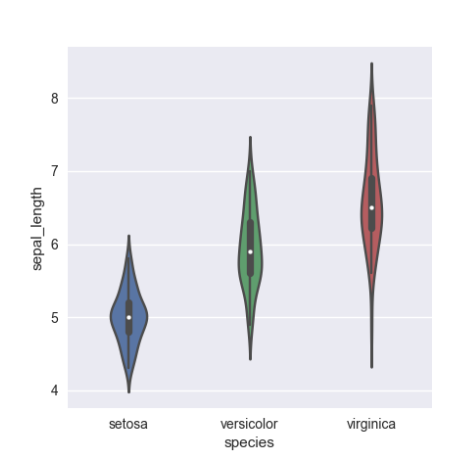
If you want to see the distribution of the data that is hidden in the bottom portion, you can add a histogram or probability plot, or even a violin plot. Each will show the distribution of the data more clearly than this boxplot does, and you can still see the true value directly. You can also add some jitter to the boxplot to see more of the overlapping points displayed.
Probability Plot with Boxplot:


