Bumped by Community user
edited body
Source Link
Gabriel Fair
  • 257
  • 1
  • 3
  • 8

Background

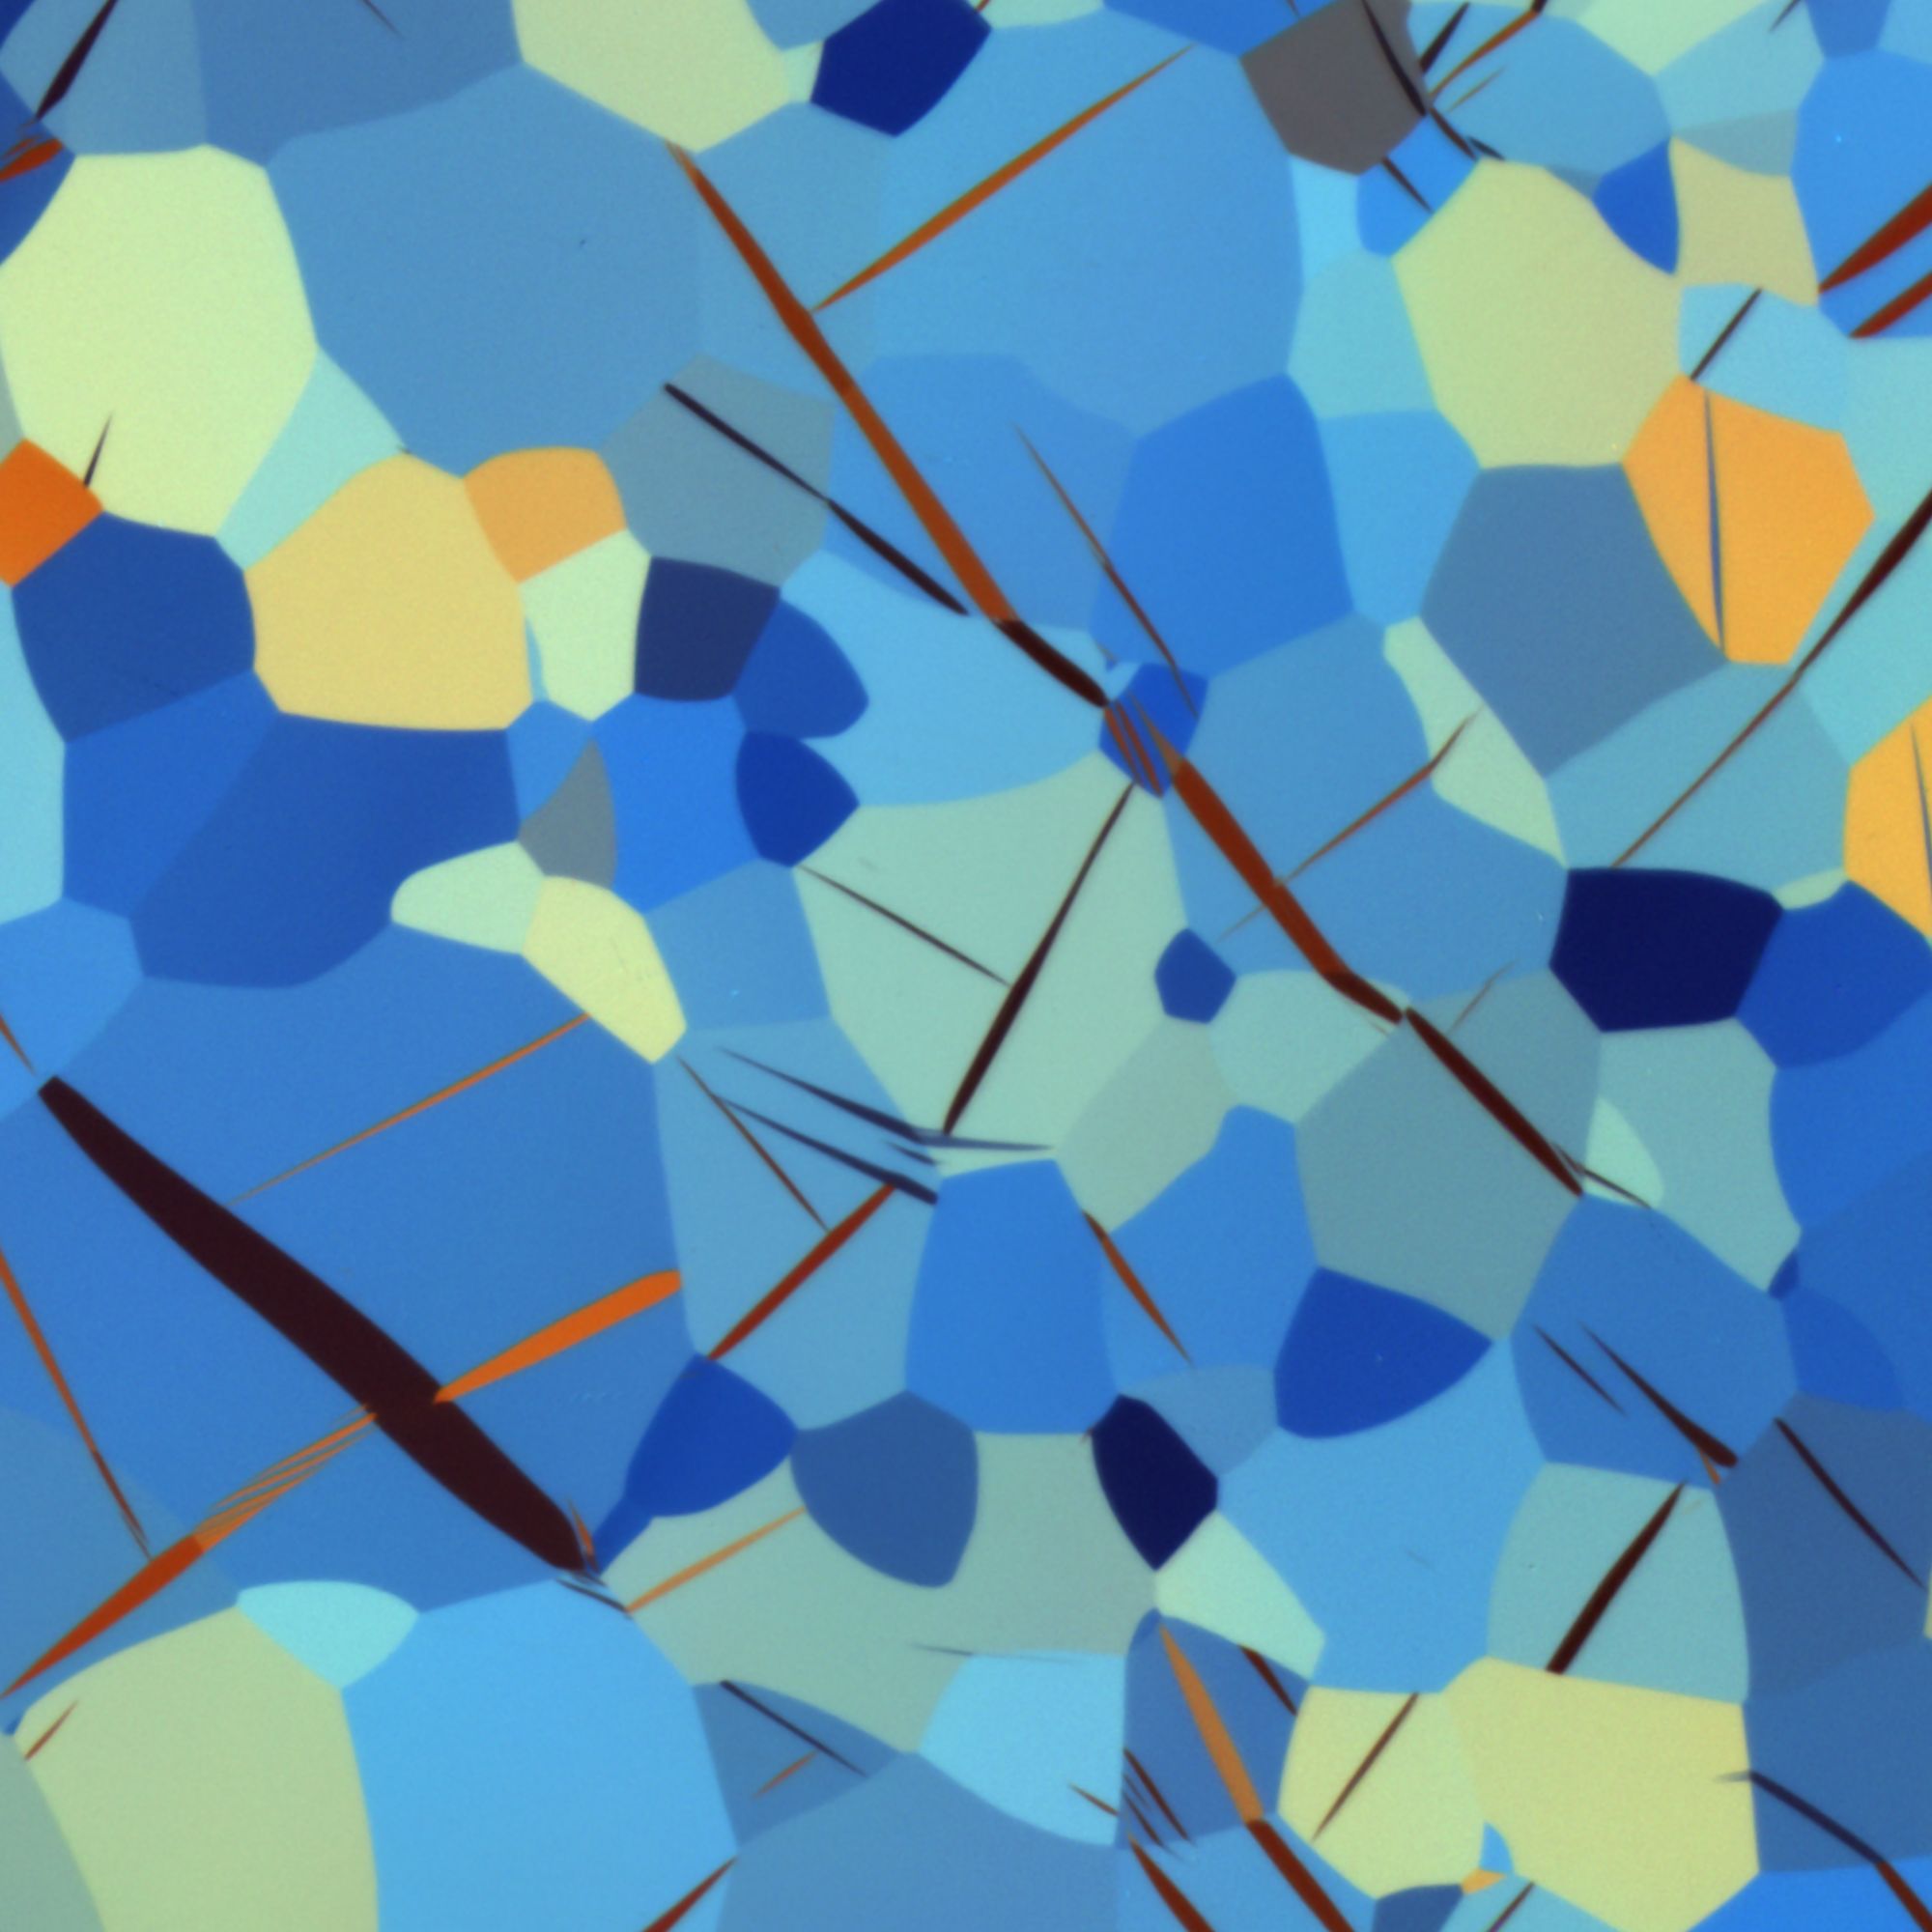
I am a PHD student trying to improve my data science. One of my research projects, has me tasked with determining the size of the clusters in a colored image of regions. Here is an example image I am using. The coloring is natural as it represents the orientation of the microscope light. The light hits the surface in different ways resulting in the different colors. But I'm not trying to sum regions of simularsimilar colors, but instead just determine the area of each of those polygon regions. I don't have ground truth or labeled images.

Problem

I am trying to calculate the size of each of these colored regions. Colored Grain regions of a microscopic material surface
Attempts to solve the problem

I don't have labeled images so I have not attempted any supervised approaches. And I don't know if my approach is wise, but my current approach has me solving two problems at once. First is detecting the edges, second is counting the pixels. Maybe there is a better approach? To detect the edges I am using K means as provided by weka. The parameters I used are below.

weka.clusterers.SimpleKMeans -init 0 -max-candidates 100 -periodic-pruning 10000 -min-density 2.0 -t1 -1.25 -t2 -1.0 -N 70 -A "weka.core.EuclideanDistance -R first-last" -I 500 -num-slots 1 -S 40

Another way I tried solving this problem is by graphing the RGB values of the pixels to determine the co-variance of the pixels in order to determine the boundaries. Then I would add the pixels between the boundaries to determine the size of the region.

Issues with my approach

By using k means, I have to know ahead of time how many colored regions are in the image and I don't know this. By using the co-variance method, it determines the boundaries well in the color array, I don't have a way of knowing the area of the region.

Question

What would a more enlightened way of going about this be, that I could try next? What method would work best here?

More information

Image format: TIF

Compression: None

Size: 2000 x 2000 Pixels (4 MPixels)

Colors: 16.7 Million (24 BitsPerPixel)

Number of Unique Colors: 382,887

Background

I am a PHD student trying to improve my data science. One of my research projects, has me tasked with determining the size of the clusters in a colored image of regions. Here is an example image I am using. The coloring is natural as it represents the orientation of the microscope light. The light hits the surface in different ways resulting in the different colors. But I'm not trying to sum regions of simular colors, but instead just determine the area of each of those polygon regions. I don't have ground truth or labeled images.

Problem

I am trying to calculate the size of each of these colored regions. Colored Grain regions of a microscopic material surface

Attempts to solve the problem

I don't have labeled images so I have not attempted any supervised approaches. And I don't know if my approach is wise, but my current approach has me solving two problems at once. First is detecting the edges, second is counting the pixels. Maybe there is a better approach? To detect the edges I am using K means as provided by weka. The parameters I used are below.

weka.clusterers.SimpleKMeans -init 0 -max-candidates 100 -periodic-pruning 10000 -min-density 2.0 -t1 -1.25 -t2 -1.0 -N 70 -A "weka.core.EuclideanDistance -R first-last" -I 500 -num-slots 1 -S 40

Another way I tried solving this problem is by graphing the RGB values of the pixels to determine the co-variance of the pixels in order to determine the boundaries. Then I would add the pixels between the boundaries to determine the size of the region.

Issues with my approach

By using k means, I have to know ahead of time how many colored regions are in the image and I don't know this. By using the co-variance method, it determines the boundaries well in the color array, I don't have a way of knowing the area of the region.

Question

What would a more enlightened way of going about this be, that I could try next? What method would work best here?

More information

Image format: TIF

Compression: None

Size: 2000 x 2000 Pixels (4 MPixels)

Colors: 16.7 Million (24 BitsPerPixel)

Number of Unique Colors: 382,887

Background

I am a PHD student trying to improve my data science. One of my research projects, has me tasked with determining the size of the clusters in a colored image of regions. Here is an example image I am using. The coloring is natural as it represents the orientation of the microscope light. The light hits the surface in different ways resulting in the different colors. But I'm not trying to sum regions of similar colors, but instead just determine the area of each of those polygon regions. I don't have ground truth or labeled images.

Problem

I am trying to calculate the size of each of these colored regions. Colored Grain regions of a microscopic material surface

Attempts to solve the problem

I don't have labeled images so I have not attempted any supervised approaches. And I don't know if my approach is wise, but my current approach has me solving two problems at once. First is detecting the edges, second is counting the pixels. Maybe there is a better approach? To detect the edges I am using K means as provided by weka. The parameters I used are below.

weka.clusterers.SimpleKMeans -init 0 -max-candidates 100 -periodic-pruning 10000 -min-density 2.0 -t1 -1.25 -t2 -1.0 -N 70 -A "weka.core.EuclideanDistance -R first-last" -I 500 -num-slots 1 -S 40

Another way I tried solving this problem is by graphing the RGB values of the pixels to determine the co-variance of the pixels in order to determine the boundaries. Then I would add the pixels between the boundaries to determine the size of the region.

Issues with my approach

By using k means, I have to know ahead of time how many colored regions are in the image and I don't know this. By using the co-variance method, it determines the boundaries well in the color array, I don't have a way of knowing the area of the region.

Question

What would a more enlightened way of going about this be, that I could try next? What method would work best here?

More information

Image format: TIF

Compression: None

Size: 2000 x 2000 Pixels (4 MPixels)

Colors: 16.7 Million (24 BitsPerPixel)

Number of Unique Colors: 382,887

Source Link
Gabriel Fair
  • 257
  • 1
  • 3
  • 8

Ways of calculating the area of colored regions in a map

Background

I am a PHD student trying to improve my data science. One of my research projects, has me tasked with determining the size of the clusters in a colored image of regions. Here is an example image I am using. The coloring is natural as it represents the orientation of the microscope light. The light hits the surface in different ways resulting in the different colors. But I'm not trying to sum regions of simular colors, but instead just determine the area of each of those polygon regions. I don't have ground truth or labeled images.

Problem

I am trying to calculate the size of each of these colored regions. Colored Grain regions of a microscopic material surface

Attempts to solve the problem

I don't have labeled images so I have not attempted any supervised approaches. And I don't know if my approach is wise, but my current approach has me solving two problems at once. First is detecting the edges, second is counting the pixels. Maybe there is a better approach? To detect the edges I am using K means as provided by weka. The parameters I used are below.

weka.clusterers.SimpleKMeans -init 0 -max-candidates 100 -periodic-pruning 10000 -min-density 2.0 -t1 -1.25 -t2 -1.0 -N 70 -A "weka.core.EuclideanDistance -R first-last" -I 500 -num-slots 1 -S 40

Another way I tried solving this problem is by graphing the RGB values of the pixels to determine the co-variance of the pixels in order to determine the boundaries. Then I would add the pixels between the boundaries to determine the size of the region.

Issues with my approach

By using k means, I have to know ahead of time how many colored regions are in the image and I don't know this. By using the co-variance method, it determines the boundaries well in the color array, I don't have a way of knowing the area of the region.

Question

What would a more enlightened way of going about this be, that I could try next? What method would work best here?

More information

Image format: TIF

Compression: None

Size: 2000 x 2000 Pixels (4 MPixels)

Colors: 16.7 Million (24 BitsPerPixel)

Number of Unique Colors: 382,887