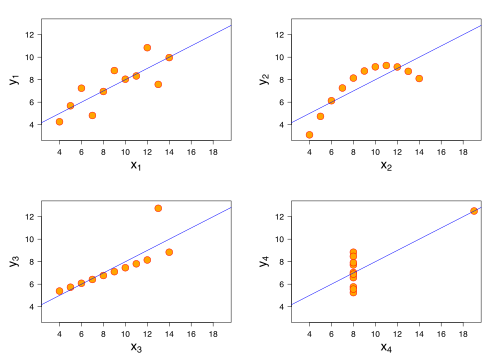
Richard Hamming is attributed with the sentence: "The purpose of computing is insight, not numbers." In this 1973 academic paper (see discussion in What is the famous data set that looks totally different but has similar summary stats?What is the famous data set that looks totally different but has similar summary stats?), Francis Anscombe argues that "graphs are essential to good statistical analysis." Anscombe's quartet is a long time favorite: same stats and regression, low dimension, yet very different behavior, regarding noise, outliers, dependancy. The projection of data in 11 dimensions onto two dimensions shown below is quite misleading: one has correlation and dispersion, the second (bottom down) has exact match, except one outlier. The third has clear relationship, but not linear. The fourth shows the variables are potentially not related, except for a threshold.
In the book Multivariate Analysis for the Biobehavioral and Social Sciences by Bruce L. Brown et al., we can find:
In his 1990 work "Drawing Things Together," Latour claims that the mindset of hard scientists is one of intense “obsession” with graphism
Whether limited to 3D space, up to six dimension plots (space, color, shape and time), or even imagining the tenth dimension, humans have limited sights. Relationships between observable phenomena: not.
Additionally, the curse of dimensions is assorted with even low dimension paradoxes, to give a few:
- Why is the curse of dimensionality also called the empty space phenomenon?Why is the curse of dimensionality also called the empty space phenomenon?
- Curse of dimensionality
- Why is Euclidean distance not a good metric in high dimensions?Why is Euclidean distance not a good metric in high dimensions?
- Paradox about high-dimensional spheres!
- The n-ball game
Even if all norms are equivalent in finite dimensions, relationships between variables might be misleading. This is one reason for preserving distances from one space to another. Such concepts are at of the heart of lower dimension embeddings for signals (such as compressive sensing and the Johnson-Lindenstauss lemma concerning low-distortion embeddings of points from high-dimensional into low-dimensional Euclidean space) or features (scattering transforms for classifications).
So visualization is another help in getting insights in the data, and it goes hand in hand with calculations, including dimension reduction.
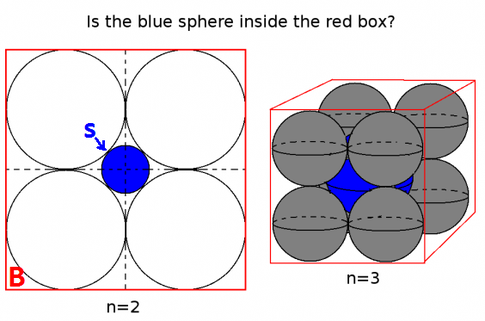
Last example: put touching $n$-spheres in an $n$-cube (the bubble inside the box, taken from Do good mathematicians visualize everything (even algebra)?):
In two dimensions, the center blue ball is small. In 3D too. But very quickly, the center ball grows and its radius exceeds that of the cube. This insight is vital n clustering, for instance.


