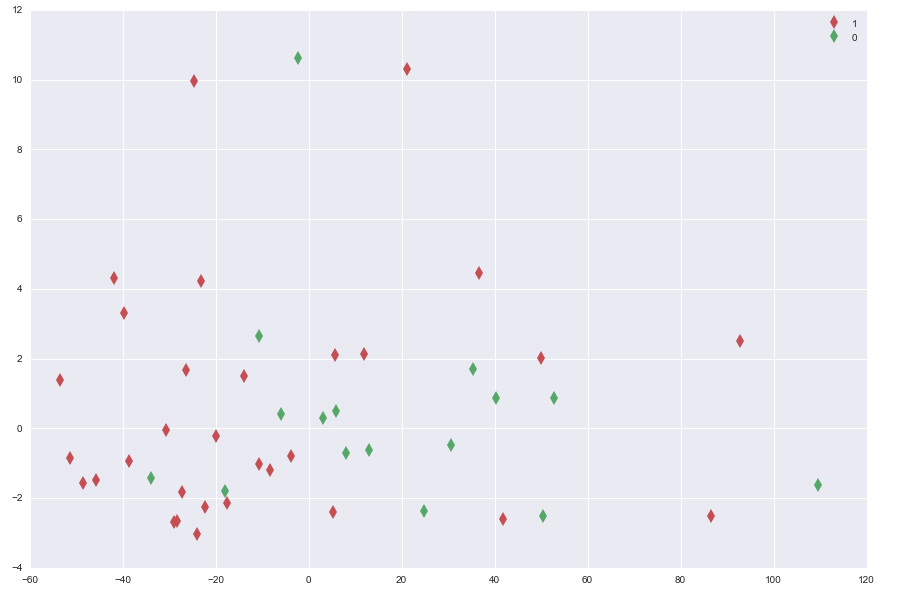
 This is the distribution of my data.
I want to use SVM with only one 'circle' to cluster most of the 0.
I tried to run it with the code
clf = svm.SVC(max_iter=1, kernel='rbf')
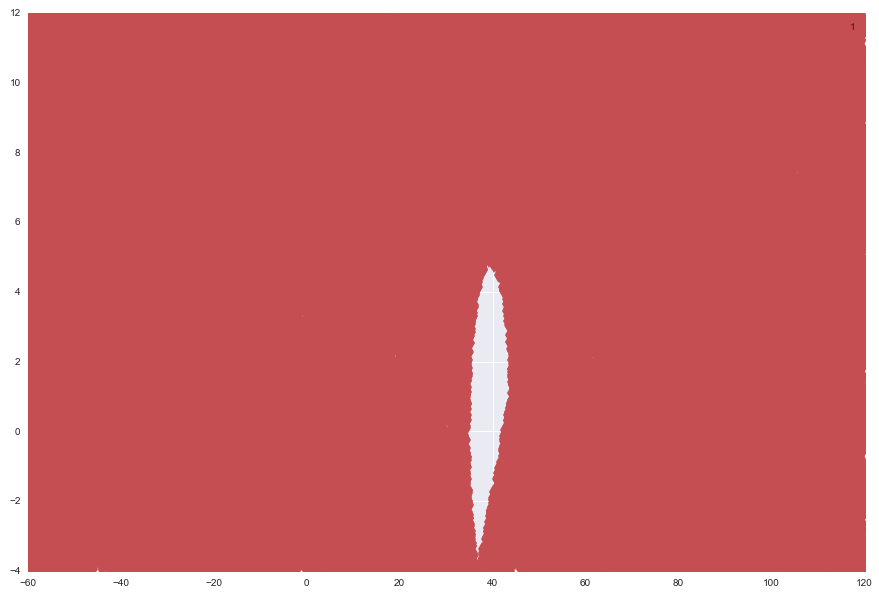
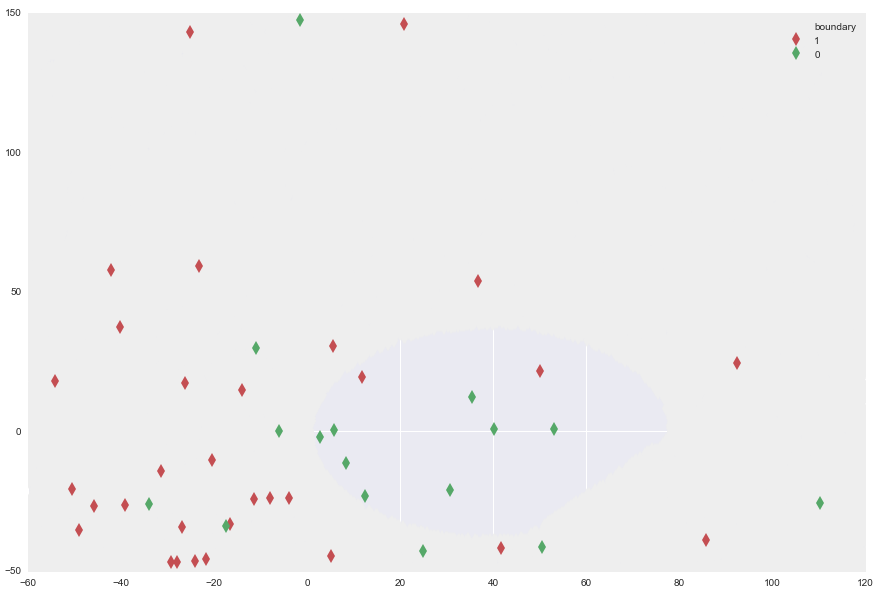
However, it gives a strange result
 How should I do it correctly?
Data:
X
array([[  5.46787217e+00,   2.09073426e-02],
       [ -2.57653443e+00,   9.77145456e+00],
       [  1.09476747e+02,  -1.71182599e+00],
       [  4.94810319e+01,  -2.77826146e+00],
       [ -1.15407498e+01,   1.94848276e+00],
       [  7.47153419e+00,  -7.67879236e-01],
       [ -3.45243619e+01,  -1.75370697e+00],
       [  2.46902913e+00,  -1.87289298e-01],
       [  3.04749853e+01,  -1.46262345e+00],
       [  1.24751661e+01,  -1.54323119e+00],
       [ -1.85219673e+01,  -2.28503662e+00],
       [ -6.53200731e+00,  -3.28311541e-02],
       [  3.44650256e+01,   7.53756355e-01],
       [  2.44812829e+01,  -2.89021667e+00],
       [  5.24685269e+01,   3.66211052e-02],
       [  3.94686575e+01,  -2.15955996e-02],
       [ -2.65369170e+01,   1.08356664e+00],
       [ -3.15280741e+01,  -9.42529350e-01],
       [ -2.35494219e+01,   3.89844921e+00],
       [ -2.85181847e+01,  -3.12756169e+00],
       [ -3.95243116e+01,  -1.77609801e+00],
       [ -8.52462300e+00,  -1.63727356e+00],
       [ -1.15245929e+01,  -1.65070818e+00],
       [ -4.25492311e+01,   3.81336326e+00],
       [ -2.25182450e+01,  -3.10069245e+00],
       [ -2.05293114e+01,  -6.98507045e-01],
       [  1.14627013e+01,   1.25373855e+00],
       [ -4.65242413e+01,  -1.80744547e+00],
       [  4.14811122e+01,  -2.81408713e+00],
       [ -5.15256196e+01,  -1.42161754e+00],
       [ -2.45182249e+01,  -3.10964886e+00],
       [  4.48148382e+00,  -2.97978083e+00],
       [ -2.75218769e+01,  -2.32534049e+00],
       [  4.94623197e+01,   1.42391045e+00],
       [ -2.95181747e+01,  -3.13203990e+00],
       [  2.04251866e+01,   9.69838626e+00],
       [  5.45907950e+00,   2.02461229e+00],
       [ -1.75219773e+01,  -2.28055841e+00],
       [ -4.05430138e+01,   2.42159570e+00],
       [ -4.52466317e+00,  -1.61936073e+00],
       [  3.64525308e+01,   3.56416072e+00],
       [ -1.45367359e+01,   9.23848192e-01],
       [ -4.95216559e+01,  -2.42386107e+00],
       [ -5.45377626e+01,   1.15293883e+00],
       [ -2.55743514e+01,   9.49238869e+00],
       [  9.24618878e+01,   1.61647340e+00],
       [  8.54806703e+01,  -2.61704597e+00]])
Y
[1, 1, 1, 1, 1, 1, 1, 1, 1, 1, 1, 1, 1, 1, 1,
 1, 0, 0, 0, 0, 0, 0, 0, 0, 0, 0, 0, 0, 0, 0,
 0, 0, 0, 0, 0, 0, 0, 0, 0, 0, 0, 0, 0, 0, 0,
 0, 0]

