0
$\begingroup$

I want to impute a numerical feature using the median, but the median for that feature is 0 and mean = 106. Should I go ahead and impute or is there anything else I can do?

PS: I don't want to create a new binary variable to capture the missingness of the data. I only want to impute using mean or median.

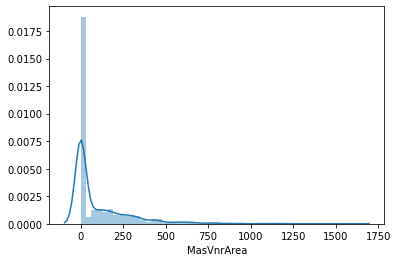
Edit 1: I have a regression task at hand, predicting house price. The variable in question carries the info about Masonry veneer area in square feet. These stats are obtained after splitting the data into train and test. There are 6 nan values. Below are some relevant stats:

  1. count 1162.000000
  2. mean 106.538726
  3. std 185.924370
  4. min 0.000000
  5. 25% 0.000000
  6. 50% 0.000000
  7. 75% 164.000000
  8. max 1600.000000

enter image description here

Edit 2: The reason I chose median is because after imputing, it doesn't distort the histogram and both the curves (before imputing and after imputing) are the same.

$\endgroup$

2 Answers 2

2
$\begingroup$

It's hard to say without seeing the distribution of the data, it would be useful if you added that, and described what the variables actually represent.

If your data is really skewed, then even if a median of 0 sounds like the wrong thing to do, it is better than using the mean since doing so will place more emphasis on the outliers in your data.

In general though, any form of imputation will be adding biases to your dataset, and if the number of missing samples is small then it may be worth ignoring those samples in your analysis.

When you impute missing values with the mean, median or mode you are assuming that the thing you're imputing has no correlation with anything else in the dataset, which is not always true.

Consider this example:

x1 = [1,2,3,4]

x2 = [1,4,?,16]

y = [3, 8, 15, 24]

For this toy example, $y = 2x_1 + x_2$. We also know that $x_2 = x_1^2$. Now suppose we wanted to do regression on X = [x1, x2] to determine the coefficients that give us the best y_hat.

If we imputed x2 with the mean or the mode, i.e. 7 or 4 we'd be adding a bias into our analysis, since that doesn't consider any interaction from x1!

Better methods would seek to learn how to predict the missing data from the other features.

I've added some links for further reading:

  1. https://towardsdatascience.com/a-comprehensive-guide-to-data-imputation-e82eadc22609
  2. https://en.wikipedia.org/wiki/Imputation_(statistics)
  3. http://num.pyro.ai/en/stable/tutorials/bayesian_imputation.html
  4. https://stats.idre.ucla.edu/wp-content/uploads/2016/02/multipleimputation.pdf
  5. https://scikit-learn.org/stable/modules/impute.html#impute
$\endgroup$
1
  • $\begingroup$ Added relevant info $\endgroup$
    – spectre
    Commented Nov 13, 2021 at 8:24
0
$\begingroup$

Another option is to impute values based on sampling from the empirical distribution. That would not "distort the histogram".

$\endgroup$
1
  • 1
    $\begingroup$ So if sampling from empirical distribution and imputing with median both result in histogram not getting distorted, I can choose any one right? $\endgroup$
    – spectre
    Commented Nov 14, 2021 at 12:51

Your Answer

By clicking “Post Your Answer”, you agree to our terms of service and acknowledge you have read our privacy policy.

Not the answer you're looking for? Browse other questions tagged or ask your own question.