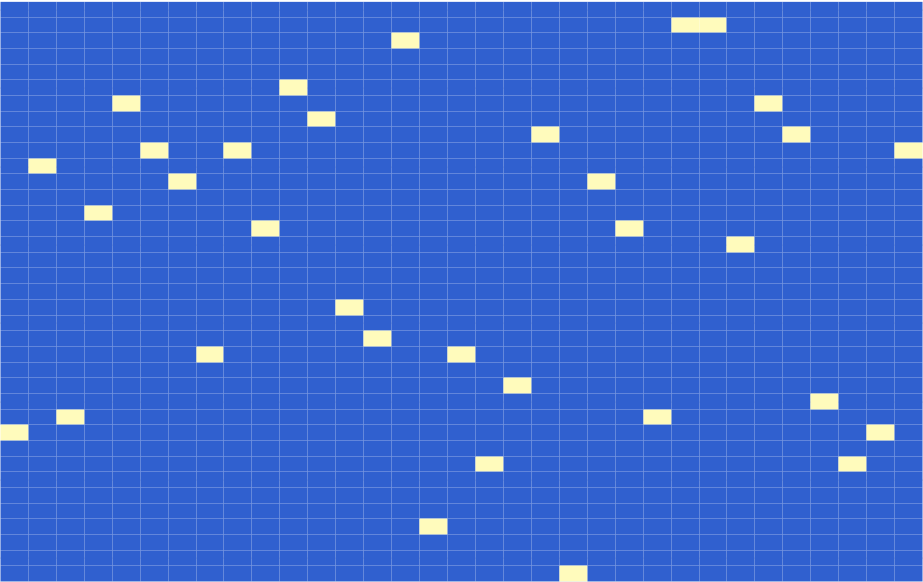
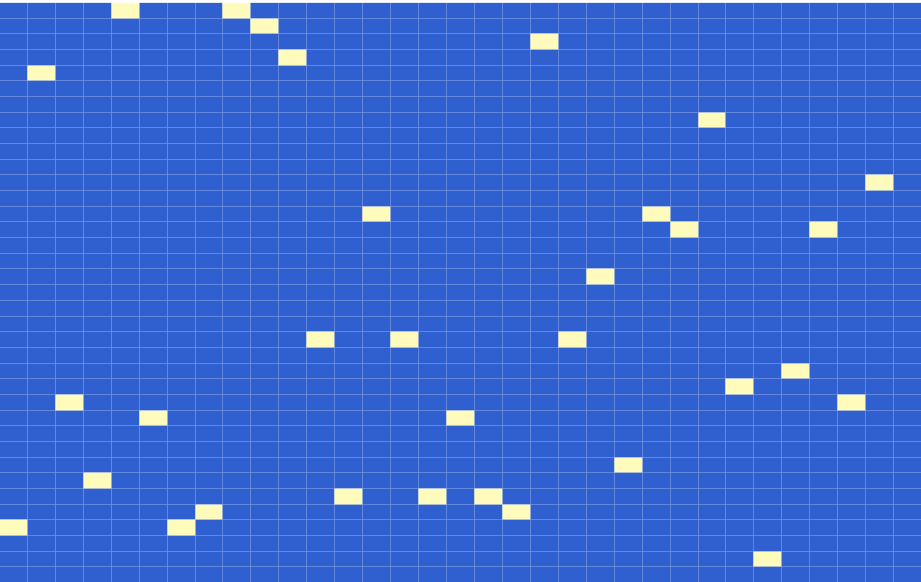
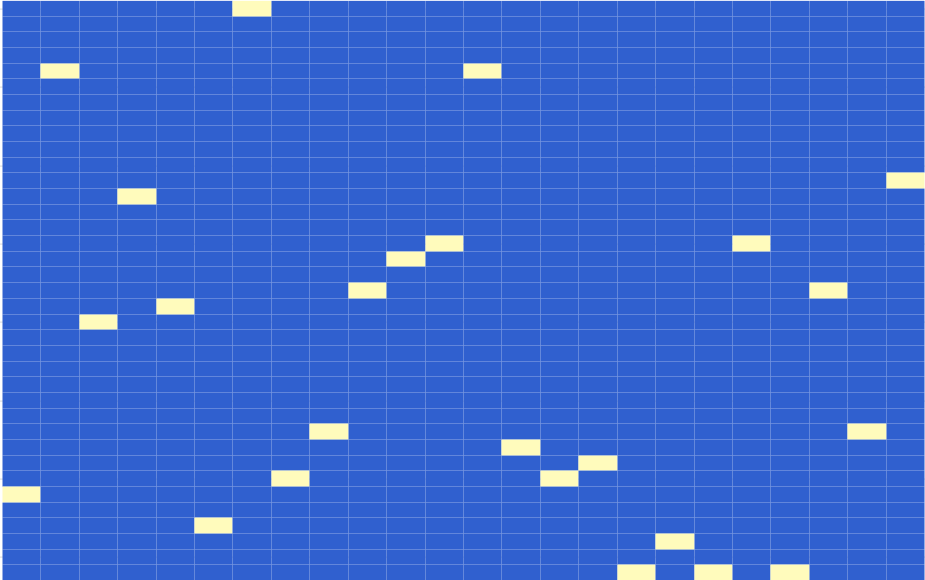
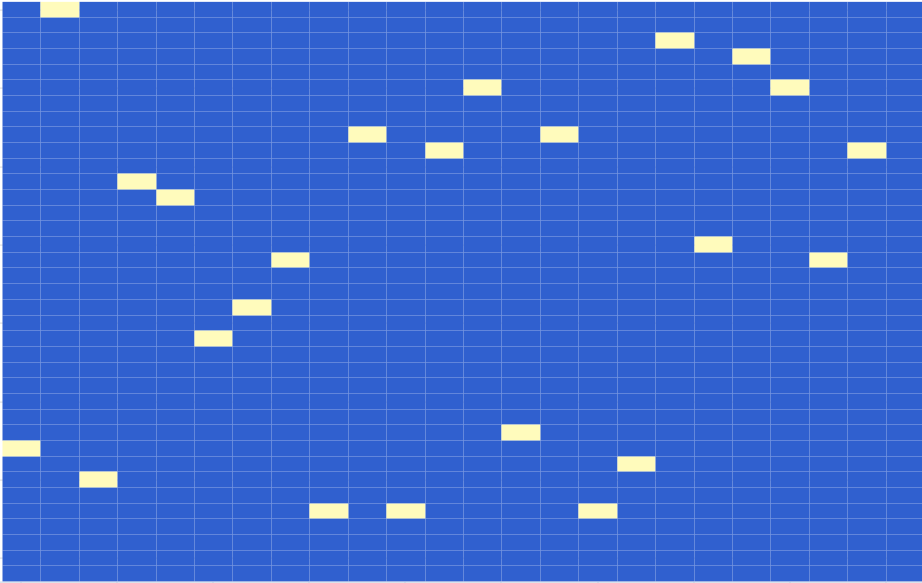
I have a series of seemingly random data dripping in one value at a time through time. Although it appears to be random, the data forms clusters when certain attributes are analysed which the charts show. I'm trying to avoid the fallacy of seeing patterns that are not there, but across several datasets the data does indeed appear to form clusters through time. I'm interested in trying to:
- detect the clusters of either the blue squares and / or the white squares in the data I have
- ignoring data which are outliers
- predicting the future shape of the clusters as data is dripped in one column at a time. (There appears to be a certain momentum through time of the cluster shapes where the current cluster areas of the new data is in nearby region of the preceding clusters)
They appear to take on regular semi-predictable shapes which (to my eyes at least) follow a momentum from the data before. How could I detect this?
My questions are:
- is this cluster analysis, and
- what would be the best way to detect the white squares and / or the blue areas. I'm guessing the blue areas would be the easiest to cluster?
- the white squares appear fairly close to the previous y-values and may continue at a certain angle up or down in value. How is the best way to predict this?


