0
$\begingroup$

I have a Random forest model that tries to predict what kind of a useful activity a machine is doing based on its power readings. There are 5 features in a single reading.

There are two main types of activities: Main (A set of useful activities. There are 6 such such activities.) and idle (the machine is not doing a useful activity).

Using an if-else method, I find whether a reading was generated by a main activity or an idle activity. Next, if the reading is from a main activity, I use the Random forest model, which has been trained with readings of main activities, to find the type of the main activity.

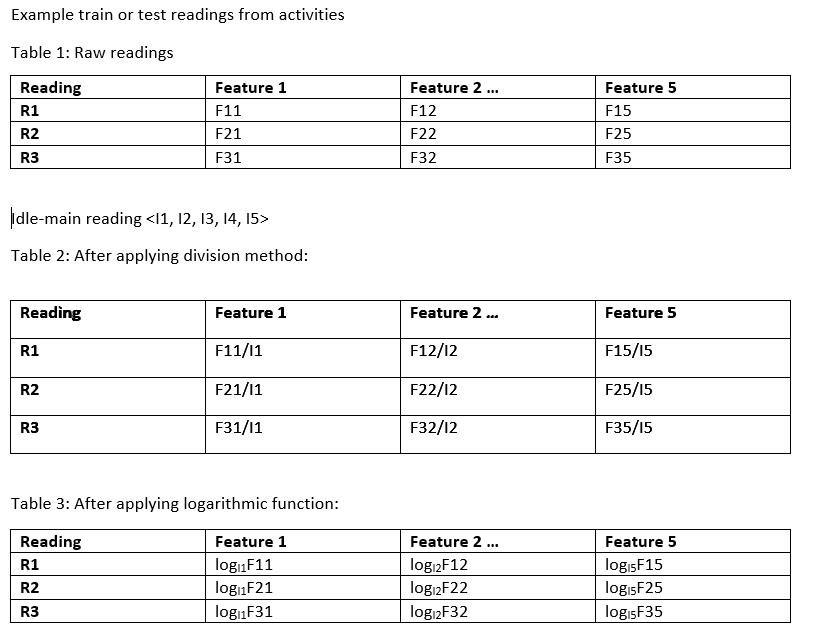
I trained the model with raw readings (Table 1 in figure) of main activities. But the model yielded poor results against the test data.

Then, I divided all the readings in the training dataset (which has only readings from main activities) by the mean of idle readings (let's call this idle-mean reading), and trained the Random forest with that (Dataset in Table 2). That also did not work well (I also divided the test data by the idle-mean reading).

Finally, I applied the logarithmic function to the training and test data. Here, each value in the dataset is replaced by the logA(B) where A (base) is the is the idle-mean reading and B (argument) is the reading (Table 3).

This yielded very good results. I tested it again and again with several test data sets.

My question: Can someone please explain why this works? My conceptual knowledge in ML is not great, so I'm having a hard time explaining this. enter image description here
$\endgroup$

1 Answer 1

2
$\begingroup$

Is your data very sparse?

Usually, the log function is very useful to reduce data variability.

On the other hand, do you apply an inverted log to check if the final result is correct?

Very often, log results seem better because the data is easier to organize, but if we apply an inverted log to find the real value, the results might be wrong.

The wrong result on raw data could be due to a wrong train/test split, potentially without randomness.

I don't know what machines you are using, but generally speaking, machines depends on sensors that are not calibrated exactly the same and those calibration issues could explain some wrong results. Best practices suggest to learn on variations (i.e. +0.3 or -2.8) instead of raw values because you don't have some calibration biases. Have you tried this option?

Example:

Raw values:

32.5  35.3 32.2  25.6

Variations:

0.    +3.2 -3.1 -6.6
$\endgroup$
9
  • $\begingroup$ Dataset is not sparse. However, the training data was collected from one device and test data from another. So, values of the readings are different, but their 'behavior' is similar. For example, suppose a reading from device A is <1, 20, 30, 1, 0> B is <0, 45, 65, 0, 1> when performing the same activity and idle-mean is <1, 1, 2, 1, 1>. We see that the values of features 2 and 3 have increased compared to idle-mean (although the exact values are different). Hence their behavior is similar. I use this notion to identify the activity. $\endgroup$
    – Nht_e0
    Commented Oct 18, 2022 at 15:23
  • $\begingroup$ Yes, the inverted log check seems to provide the correct result. $\endgroup$
    – Nht_e0
    Commented Oct 18, 2022 at 15:24
  • 1
    $\begingroup$ In that case, maybe building specific models per manufacturer could be better for a start. Once the differences between machines are detected, you can try to enlarge the groups to several manufacturers. RF could also work if you add a column "manufacturer" to segregate or group cases. $\endgroup$ Commented Oct 18, 2022 at 20:06
  • 2
    $\begingroup$ Could also be since log is a non-linear transformation, the test machine's numbers are shrunk more, they are larger, and now fall on the other side of splits. This is not what you want in a model as it will not generalize to additional machines. When behavior is similar is mentioned between the machines, CART based trees do not look at difference or correlation. Like Nicolas mentioned, making separate models or including multiple manufacturers might help. Or find a way to normalize the numbers across machines so they are all on the same scale. $\endgroup$
    – Craig
    Commented Oct 19, 2022 at 11:04
  • 1
    $\begingroup$ Hi @NicolasMartin, Sorry for the later reply. Thank you for your input. The previous version does exactly this. What I am trying is an improvement (kind of get one model to do what several models do). $\endgroup$
    – Nht_e0
    Commented Oct 24, 2022 at 21:36

Your Answer

By clicking “Post Your Answer”, you agree to our terms of service and acknowledge you have read our privacy policy.

Not the answer you're looking for? Browse other questions tagged or ask your own question.