1
$\begingroup$

I am currently doing my master's thesis and at the end of finishing it, but there are some questions raised by my supervisor. I have answered most of the questions, but only one question is remaining and I don't know how to answer it.

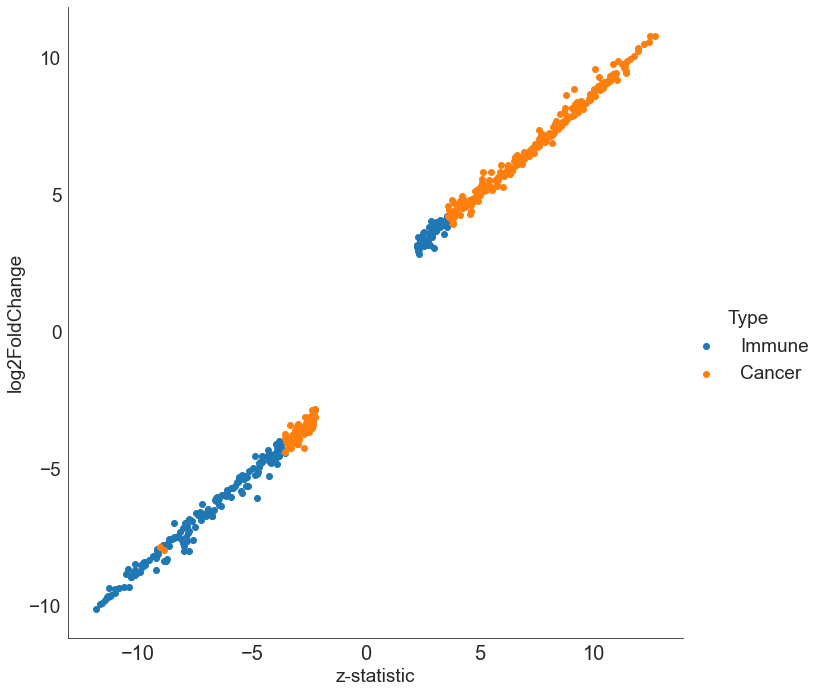
I am doing my master thesis on classifying the given medical data into Cancer or Immune, and the visualization of data points after preprocessing looks like the below image,

Proprocessed data

Now, I have used SVM with kernels, Decision Trees, and Random Forests algorithms to classify the data points and they yield a very good accuracy and F1 score, but my supervisor is asking the following question

I can nearly perfectly classify this data by drawing three vertical lines. Instead, very complicated decision trees are provided. It should be discussed why it is not appropriate to draw such three vertical lines, or if it is, why the algorithms do not find them. The quality of the classifiers according to the decision trees should be compared with the simple method I propose.

So could you please share your knowledge on this question and help me?

$\endgroup$

2 Answers 2

1
$\begingroup$

Basically this would be an alternative classification system based on manual rules, i.e. a heuristic. The system is a just simple algorithm like this:

if zstat < -3 and log2FoldChange < 6 then return immune
if zstat > -3 and log2FoldChange > 6 and zstat < 0 and log2FoldChange < 0 then return cancer
if zstat < 4 and log2FoldChange < 4 and zstat > 0 and log2FoldChange > 0 then return immune
if zstat > 4 and log2FoldChange > 4 then return cancer 

(I chose the values approximately, try to select them as accurately as possible)

This is a classifier. When you apply this algorithm to your test set, you obtain predictions that you can evaluate in the same way that you did with ML methods. So you can answer the question of the performance of this method (probably a bit lower than with ML).

About why your algorithm doesn't find this, you would have to analyze. It could be that the algorithm is more precise, but it could also be that it overfits.

$\endgroup$
1
$\begingroup$

you don't even need 2 features. Any of the features you have and a decision tree with depth 3. Then I googled "sklearn visualize decision tree" and got https://mljar.com/blog/visualize-decision-tree/

You can do one of the visualizatin technics and apply it to your current overcomplex decision tree to understand it's splits.

$\endgroup$

Your Answer

By clicking “Post Your Answer”, you agree to our terms of service and acknowledge you have read our privacy policy.

Not the answer you're looking for? Browse other questions tagged or ask your own question.