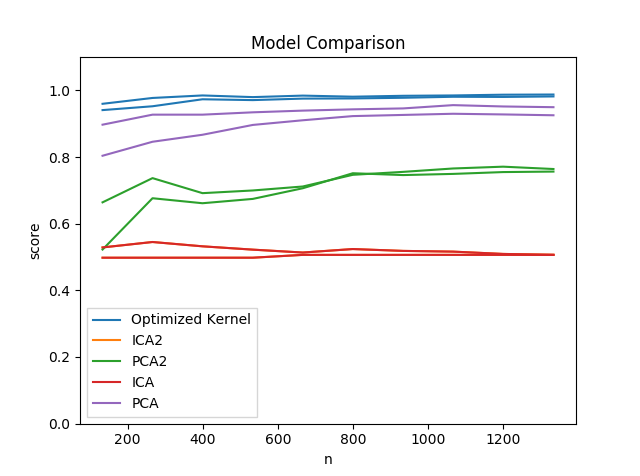
As a stepping stone towards a project involving classification of data points having multidimensional and imaginary features, I decided to try to solve first a simple problem: given 2 random points with coordinates (x1,y1) and (x2,y2), can a program classify the data according to the sign of the slope these two points have?
Obviously, there is a link between x1 and y1 (and x2 and y2). Since all sklearn input files should be 2D (so adding a tuple or array as an input feature is not possible). I compared already different approaches to handle this (see below). However, here's my question:
How to improve classification of data with multidimensional features in python/sklearn after transformation of the datapoint from NxM matrix to 1xNM matrix?
note: I have read these questions
- https://stackoverflow.com/questions/11999147/is-it-possible-to-use-complex-numbers-as-target-labels-in-scikit-learn
- https://stackoverflow.com/questions/33483347/using-complex-valued-data-in-a-randomforestclassifier
- machine learning algorithms for 2d data?
so I am aware of the solution to just dissociate the data into two features (that is not my question), but as shown below, it seems hard for the learner to see a link between them without help.
Preparing the data
This is how I generate the data.
def generate_and_write_data(n):
    np.random.seed(358)
    data = pd.DataFrame(np.random.randn(n, 4), columns=('x1', 'x2', 'y1', 'y2'))

    slopes = pd.Series((data.y2-data.y1)/(data.x2-data.x1))
    types = pd.Series(np.sign((data.y2-data.y1)/(data.x2-data.x1)))
    xdiff = pd.Series((data.x2-data.x1))

    data['xdifference'] = pd.Series(xdiff, index=data.index)
    data['slopetype'] = pd.Series(types, index=data.index)
    data['slopes'] = pd.Series(slopes, index=data.index)
    return data
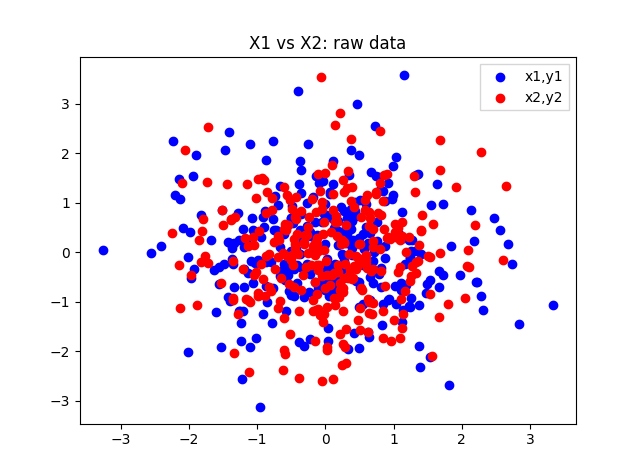
Which results in the following plotted data
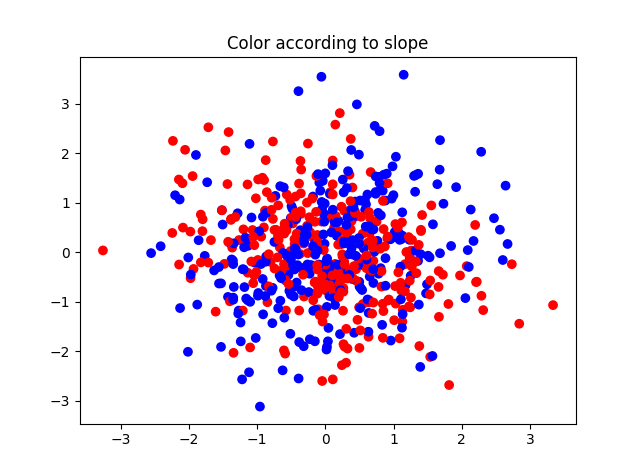
Or, same data but colored according to the slope (so you can see a kind of trend)
There are two pipelines I constructed, because I initially thought an ICA could do better than a PCA. Also, since I wanted to end up with only 2 components (intuitively, one for each point?), I added these models to the comparison.
icamodel = make_pipeline(FastICA(), svm.SVC())
pcamodel = make_pipeline(PCA(), svm.SVC())
icamodel2 = make_pipeline(FastICA(2), svm.SVC())
pcamodel2 = make_pipeline(PCA(2), svm.SVC())
Then I have several post-treatments of the data:
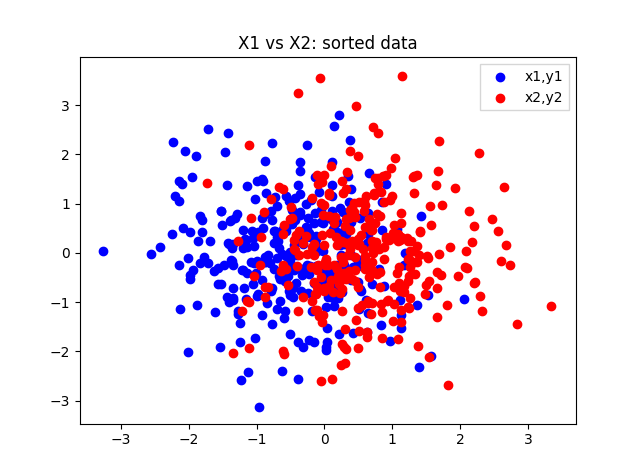
- Sorting (changing x1 and x2, as well as y1 and y2), so the x1 is always lower than x2 (see below for an image)
- Using the distance between x1 and x2 as a feature, combined with y1 and y2. (so the x-values are omitted. See above in the data construction)
- Sorting, and only feeding the y-values to the model.
Here is how I sort the data
Xdiff = df.loc[:, 'y1':'xdifference']

X_order = map((lambda x1,x2,y1,y2: [x1,x2,y1,y2] if x1 < x2 else [x2,x1,y2,y1]), X.x1, X.x2, X.y1, X.y2)
X_order = pd.DataFrame(X_order, columns=('x1', 'x2', 'y1', 'y2'))

X2_order = map((lambda x1,x2,y1,y2: [y1,y2] if x1 < x2 else [y2,y1]), X.x1, X.x2, X.y1, X.y2)
X2_order = pd.DataFrame(X2_order, columns=('y1', 'y2'))
Model output
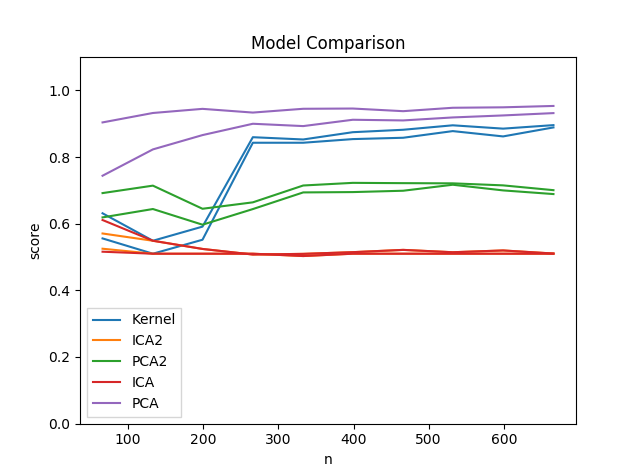
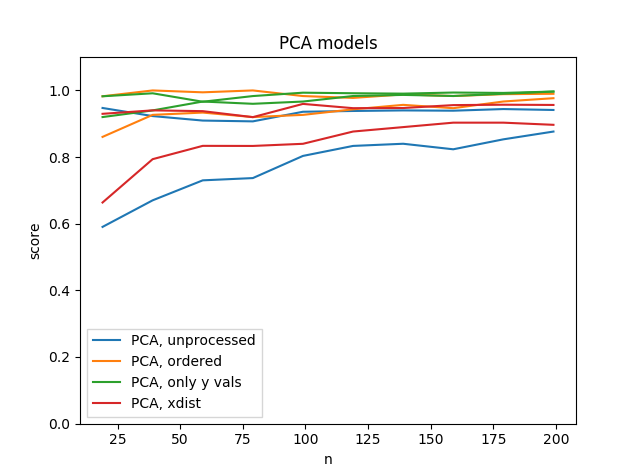
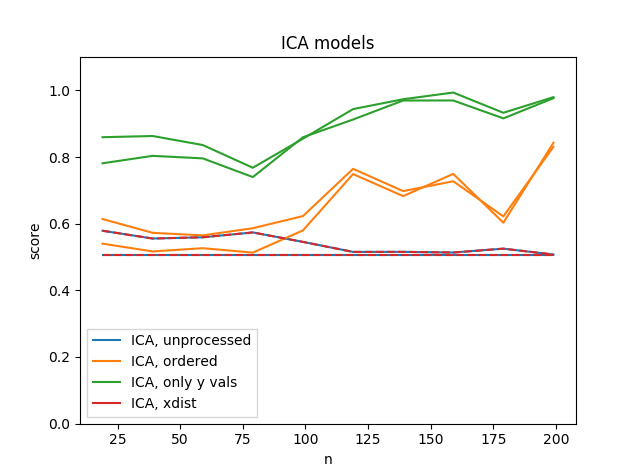
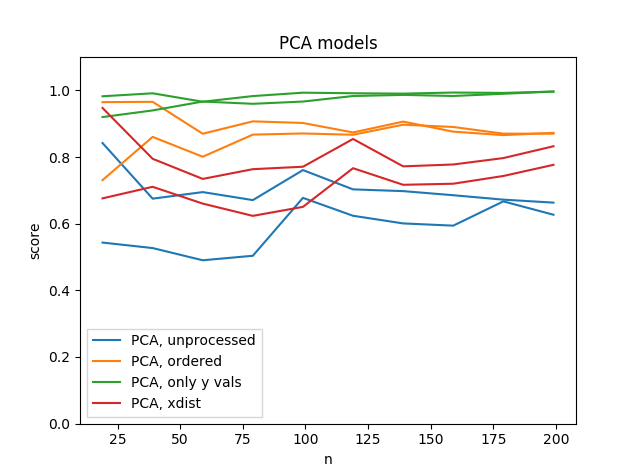
The comparison of these two different models (PCA vs ICA) with the different data treatments yielded a huge difference in performance. I constructed the learning curves for all models, feeded with the different datasets (training score and validation score are in the same color). They are pictured below.
Different data inputs, training the PCA model, mapping to 4 vectors:
Different data inputs, training the ICA model, mapping to 4 vectors. The unprocessed and xdist models seem to be equivalent:
Different data inputs, training the PCA model, mapping to 2 vectors.
Different data inputs, training the ICA model, mapping to 2 vectors. The unprocessed and xdist models seem to be equivalent.
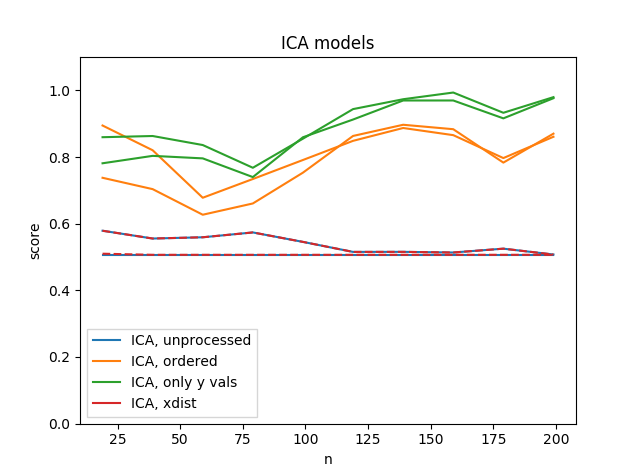
It seems that the model where I sort, omit the x data and feed the y data to the model always performs best. However, this feels like an huge simplification of the model and won't help me with the complex numbers. also, note that the ICA model performs as good as the PCA model when we map to 2 dimensions and feed all ordered data.
Currently I prefer the PCA mapping to 4 dimensions, with the ordered data. It does quite a good job, but still not as good as I want it. I'd welcome any suggestion for transforming the data.
As a sidenote, As soon as I used the FastICA in a pipeline, I got the warning 'FastICA did not converge' as discussed here https://github.com/rhiever/tpot/issues/148 so comparing the models is probably not possible until I find the right tolerance/number of iterations for the ICA. However, this only happened when I used the ICA in a pipeline. When I used it separately, it was able to map the sorted X data to two different regions which were discernible by eye without the error.

