5
$\begingroup$

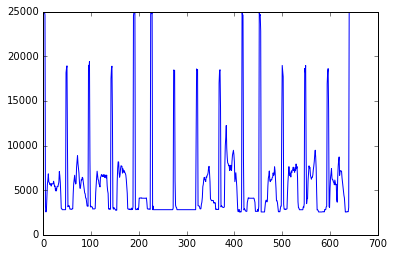
I have pile of vectors where the values could be plotted like this:

enter image description here

Now I want to extract the "spike values" (over a certain threshold say 15,000). In this case there is fifteen. How could this be done with Python? (There is no predefined number of spikes but the threshold is a reliable filter value.)

$\endgroup$

3 Answers 3

9
$\begingroup$

This is very simple. Let's say your data in Panda format (named data_df), and extracting peaks/spikes over a certain threshold (e.g. 15000 here) is simply:

data_df[data_df > 15000]

If this data is sitting in a particular column, you can use this instead:

data_df[data_df['column_name'] > 15000]

These will return the peak values.

Updated Answer:

If you want local extreme points (e.g. maximum or minimum ) around each peak, check scipy.signal.argrelextrema in Scipy. A concrete example:

Let's make a artificial random data with random spikes:

import numpy as np                    
import matplotlib.pyplot as plt 

random_number1 =np.random.randint(0,200,20)
random_number2=np.random.randint(0,20,100)
random_number=np.concatenate((random_number1,random_number2))
np.random.shuffle(random_number)
plt.plot(random_number)
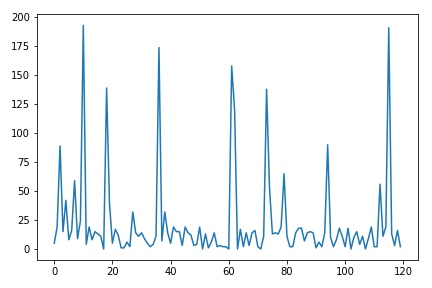
original data

Now using argrelextrema function you will find the index of relative extreme values (either minimum or maximum)

c_max_index = argrelextrema(random_number, np.greater, order=5)

Please make sure you understand the "order" option. It basically look around 5 neighbouring points, and it returns the maximum in this case. And you can see how it works by pinpointing the found points on the actual graph like this:

plt.plot(random_number)
plt.scatter(c_max_index[0],random_number[c_max_index[0]],linewidth=0.3, s=50, c='r')
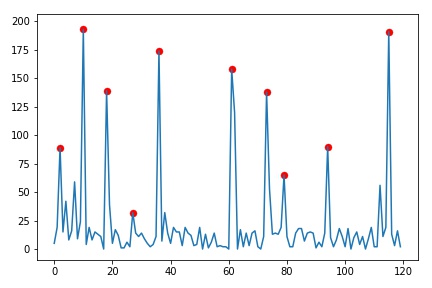
original data with peak points in red

Note that you can retrieve peak points via random_number[c_max_index[0]], and c_max_index are just indexes of the extreme points.

$\endgroup$
3
  • 1
    $\begingroup$ I don't want to get ALL values over the threshold but only ONE (the highest) values per peak. This is different. $\endgroup$
    – Hendrik
    Commented Jan 25, 2018 at 12:18
  • $\begingroup$ I see. Honestly it was not quite clear this is what you want. Perhaps you want local maximum values nearby each peak. This is a different story. Please see the updated answer likely doing what you want. $\endgroup$ Commented Jan 25, 2018 at 13:23
  • 1
    $\begingroup$ You may like to check this example (just came across it today): github.com/demotu/BMC/blob/master/notebooks/DetectPeaks.ipynb $\endgroup$ Commented May 28, 2018 at 13:15
3
$\begingroup$

As of SciPy version 1.1, you can also use find_peaks (data borrowed from @Majid Mortazavi's answer:

import numpy as np                    
import matplotlib.pyplot as plt
from scipy.signal import find_peaks 

np.random.seed(42)

# borrowed from @Majid Mortazavi's answer
random_number1 = np.random.randint(0, 200, 20)
random_number2 = np.random.randint(0, 20, 100)
random_number = np.concatenate((random_number1, random_number2))
np.random.shuffle(random_number)

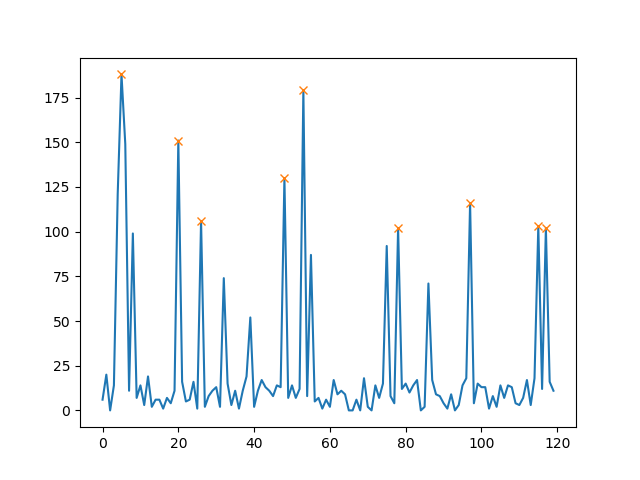
peaks, _ = find_peaks(random_number, height=100)

plt.plot(random_number)
plt.plot(peaks, random_number[peaks], "x")
plt.show()

This will plot (threshold=100):

enter image description here

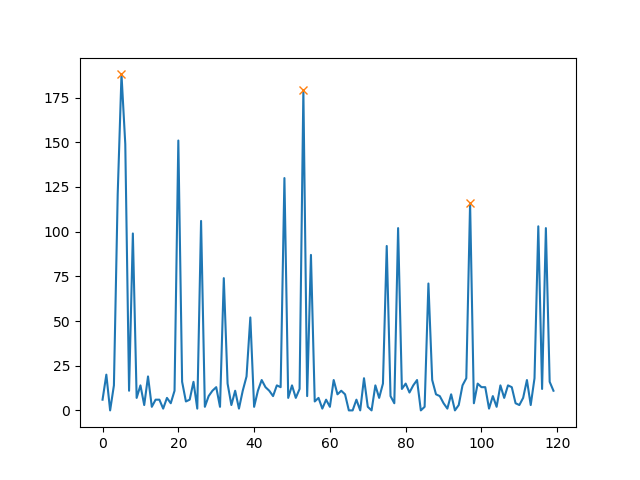
Besides the height, you can also set the minimal distance between peaks (e.g. 30):

enter image description here

In this case you would use (rest of the code identical):

peaks, _ = find_peaks(random_number, height=100, distance=30)
$\endgroup$
0
$\begingroup$

You could implement some sort of sliding window algorithm with with a window size of ca. 50 (according to your diagram) and then pick only the highest value within the window.

$\endgroup$

Your Answer

By clicking “Post Your Answer”, you agree to our terms of service and acknowledge you have read our privacy policy.

Not the answer you're looking for? Browse other questions tagged or ask your own question.