3
$\begingroup$

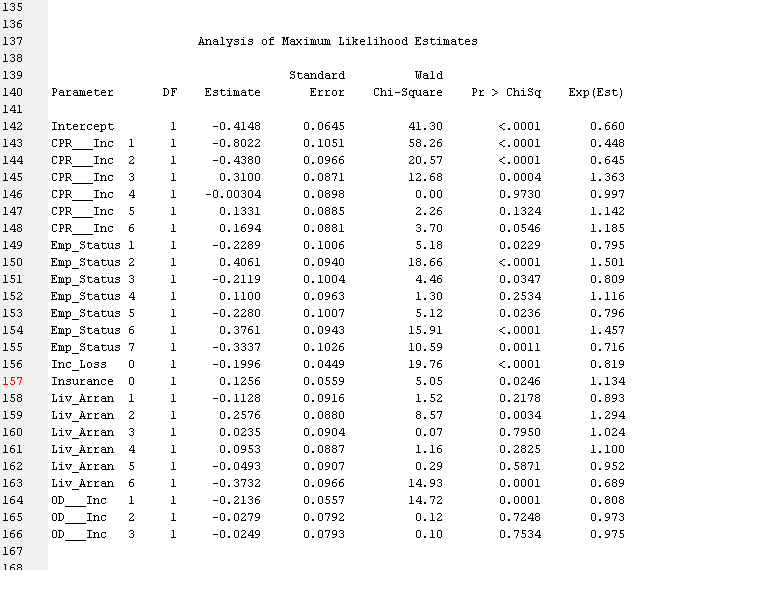
enter image description here

I am trying to do Logistic Regression using SAS Enterprise Miner. My Independent variables are

CPR/Inc (Categorical 1 to 7)
OD/Inc (Categorical 1 to 4)
Insurance (Binary 0 or 1)
Income Loss (Binary 0 or 1)
Living Arrangement (Categorical 1 to 7)
Employment Status (categorical 1 to 8)

My Dependent Variable is Default (Binary 0 or 1)

The following is the output from running Regression Model.

Analysis of Maximum Likelihood Estimates

                                  Standard          Wald
Parameter       DF    Estimate       Error    Chi-Square    Pr > ChiSq    Exp(Est)

Intercept        1     -0.4148      0.0645         41.30        <.0001       0.660
CPR___Inc  1     1     -0.8022      0.1051         58.26        <.0001       0.448
CPR___Inc  2     1     -0.4380      0.0966         20.57        <.0001       0.645
CPR___Inc  3     1      0.3100      0.0871         12.68        0.0004       1.363
CPR___Inc  4     1    -0.00304      0.0898          0.00        0.9730       0.997
CPR___Inc  5     1      0.1331      0.0885          2.26        0.1324       1.142
CPR___Inc  6     1      0.1694      0.0881          3.70        0.0546       1.185
Emp_Status 1     1     -0.2289      0.1006          5.18        0.0229       0.795
Emp_Status 2     1      0.4061      0.0940         18.66        <.0001       1.501
Emp_Status 3     1     -0.2119      0.1004          4.46        0.0347       0.809
Emp_Status 4     1      0.1100      0.0963          1.30        0.2534       1.116
Emp_Status 5     1     -0.2280      0.1007          5.12        0.0236       0.796
Emp_Status 6     1      0.3761      0.0943         15.91        <.0001       1.457
Emp_Status 7     1     -0.3337      0.1026         10.59        0.0011       0.716
Inc_Loss   0     1     -0.1996      0.0449         19.76        <.0001       0.819
Insurance  0     1      0.1256      0.0559          5.05        0.0246       1.134
Liv_Arran  1     1     -0.1128      0.0916          1.52        0.2178       0.893
Liv_Arran  2     1      0.2576      0.0880          8.57        0.0034       1.294
Liv_Arran  3     1      0.0235      0.0904          0.07        0.7950       1.024
Liv_Arran  4     1      0.0953      0.0887          1.16        0.2825       1.100
Liv_Arran  5     1     -0.0493      0.0907          0.29        0.5871       0.952
Liv_Arran  6     1     -0.3732      0.0966         14.93        0.0001       0.689
OD___Inc   1     1     -0.2136      0.0557         14.72        0.0001       0.808
OD___Inc   2     1     -0.0279      0.0792          0.12        0.7248       0.973
OD___Inc   3     1     -0.0249      0.0793          0.10        0.7534       0.975

Now I used this Model to Score a new set of data. An example row of my new data is

CPR - 7
OD - 4
Living Arrangement - 4
Employment Status - 4
Insurance - 0
Income Loss - 1

For this sample row, the model predicted output (Probability of default = 1) as 0.7335 To check this manually, I added the estimates

Intercept + Emp Status 4 + Liv Arran 4 + Insurance 0
-0.4148   + 0.1100  +   0.0953   +   0.1256    =   -0.0839

Odds ratio = Exponential(-0.0839) = 0.9195

Hence probability = 0.9195 / (1 + 0.9195) = 0.4790

I am unable to understand why there is such a mismatch between the Model's predicted probability and theoretical probability.

Any help would be much appreciated . Thanks

$\endgroup$
3
  • $\begingroup$ I don't know much about SAS, but your math is clearly right. Perhaps it's a bug in how you called the model predicted output? $\endgroup$
    – jbencook
    Commented Jun 19, 2014 at 17:49
  • $\begingroup$ Ben, thanks for the reply. I called the Scoring node directly from SAS Enterprise Miner, not much options we can change there. I compared the scoring output with what R predicted, and they perfectly matched. Then used the estimates manually , R's estimates theoretically matched with the output. It's just the problem with what SAS is giving as output, I am unable to understand that. $\endgroup$ Commented Jun 20, 2014 at 18:45
  • $\begingroup$ Well I'm glad you were able to get a reasonable result with R! Hopefully someone who knows why this issue exists in SAS can answer the question! $\endgroup$
    – jbencook
    Commented Jun 22, 2014 at 13:04

1 Answer 1

2
$\begingroup$

It's probably due to the effect coding of categorical predictors. Eg, the regression coefficient for CPR = 7 is not zero but -(sum of regression coefficients for the other 6 levels). I guess EM should have an option to switch it to reference coding, then your way of computing the predicted probability should work.

$\endgroup$

Your Answer

By clicking “Post Your Answer”, you agree to our terms of service and acknowledge you have read our privacy policy.

Not the answer you're looking for? Browse other questions tagged or ask your own question.