0
$\begingroup$

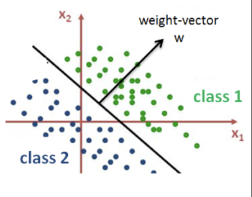
This figure represents a perceptron model with a 2 dimensional feature vector input.

enter image description here

The hypothesis space of the perceptron is defined by this set:

$\{y | y = w\cdot x + b\}$

What is the geometrical representation of the y value in this perceptron plot? Is it the perpendicular distance from a point to the separating hyperplane?

$\endgroup$
1
  • $\begingroup$ To my interpretation, if we were to ignore the bias term $b$ for a moment, then $y$ is like a cosine similarity measure of the datapoint $x$ with the weight vector $w$. The smaller the angle between the vector $w$ and $x$, the large is the cosine between the two which is captured in the dot product $w.x$. Now if we add back the interpretation of the bias term $b$, it tells us at which value of cosine similarity would you start labeling a data point as class $1$ vs class $-1$. $\endgroup$
    – Deb Nandy
    Commented Jun 7, 2019 at 3:02

1 Answer 1

2
$\begingroup$

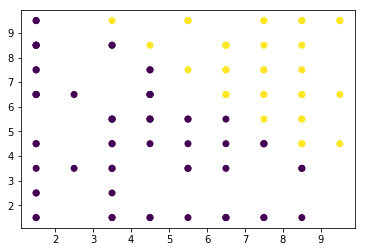
in the context of binary classification, Y indicate the point at ($x_1,x_2$) belongs to positive(1) or negative(-1)

this piece of code is helpful to understand this

import numpy as np
import random
def generate_data(no_points):
    X = np.zeros(shape=(no_points, 2))
    Y = np.zeros(shape=no_points)
    for ii in range(no_points):
        X[ii][0] = random.randint(1,9)+0.5
        X[ii][1] = random.randint(1,9)+0.5
        Y[ii] = 1 if X[ii][0]+X[ii][1] >= 13 else -1
    return X, Y
X, Y = generate_data(100)
plt.scatter(X[:,0],X[:,1],c=Y)

enter image description here

in this figure, positive(1) class is shown as yellow, and negative(-1) class is shown as purple.

$\endgroup$

Your Answer

By clicking “Post Your Answer”, you agree to our terms of service and acknowledge you have read our privacy policy.

Not the answer you're looking for? Browse other questions tagged or ask your own question.