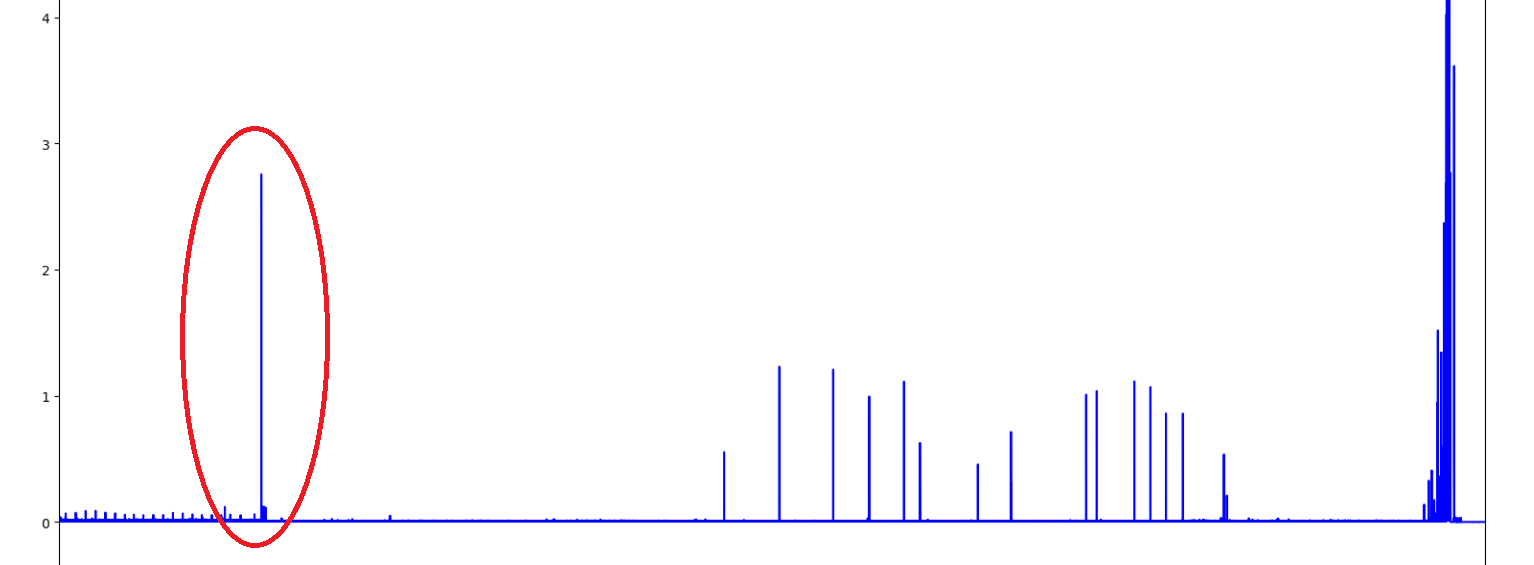
I have time series data which looks like the graph mentioned below.
I am familiar with the method of removing outliers based on the standard deviation and median values. Drawback of these methods are that they do not account for the neighboring data points.
For example, in the data show below I do not want to remove the values which are simply maximum or standard deviation away from the mean. I want to remove the points which are circled in the red. The other extreme values are common in the area should not be detected as outlier as these data points have similar nearby data points.
Is there any method to remove these points or is there any python library I can use to remove these points. Normal standard deviation and median filters do not work well for these as they also remove the points which are not circled.

