1
$\begingroup$

I have a dataset including 100k high dimensional data (e.g. houses in LA) (dim=100, e.g. house parameters like area, distance to downtown, etc.). Below is the 2-component PCA representation of the data, colored by target value (e.g. housing price). enter image description here
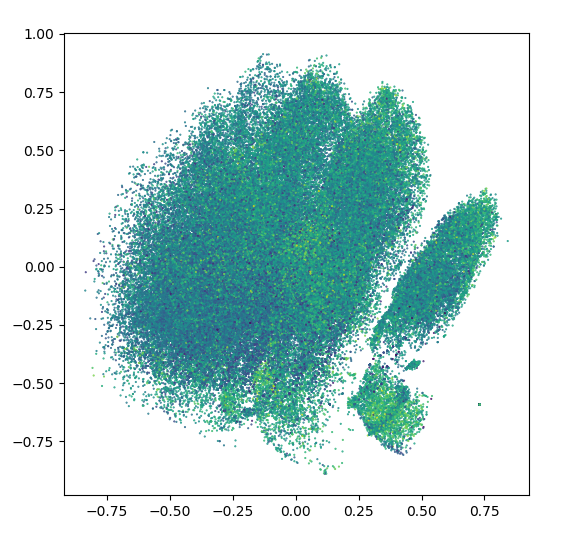
As you can see, price function has a stochastic behavior and changes rapidly everywhere.

  1. Is there a dimensionality reduction method that takes the target value into account and as a result, it aggregates low priced homes on one side and we can see a gradient of housing prices in the map?
  2. Can manifold learning help in anyway with this task?

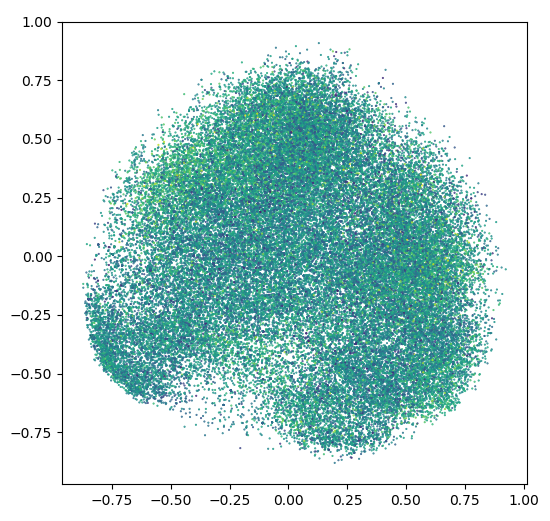
I tried Backward feature extraction based on ridge regression to reduce the dimensionality based on their effect on regression results on target value, and then applied PCA and normalized it, but the output was not as desired. Here is the output: enter image description here
Thanks

$\endgroup$

1 Answer 1

0
$\begingroup$

Actually the first plot is still better! The first point to mention is that in 2d you lose a vast amount of information i.e. none of these plots are necessarily telling you something. If the 2d plot is good you can be happy but if not, you should not necessarily get disappointed! I strongly recommend you to see the performance of your dimensionality reduction by evaluating your regression model.

For 100 dimensions I would first try to find correlation/dependence of features and target (try not to use linear correlation without visualization!). Then, out of all features remove non informative ones. On the remaining features try different dimensionality reduction algorithms (not only PCA, for example NMF if values are all non-negative and/or LLE) with more dimensions. Evaluate your results on your validation set.

$\endgroup$

Your Answer

By clicking “Post Your Answer”, you agree to our terms of service and acknowledge you have read our privacy policy.

Not the answer you're looking for? Browse other questions tagged or ask your own question.