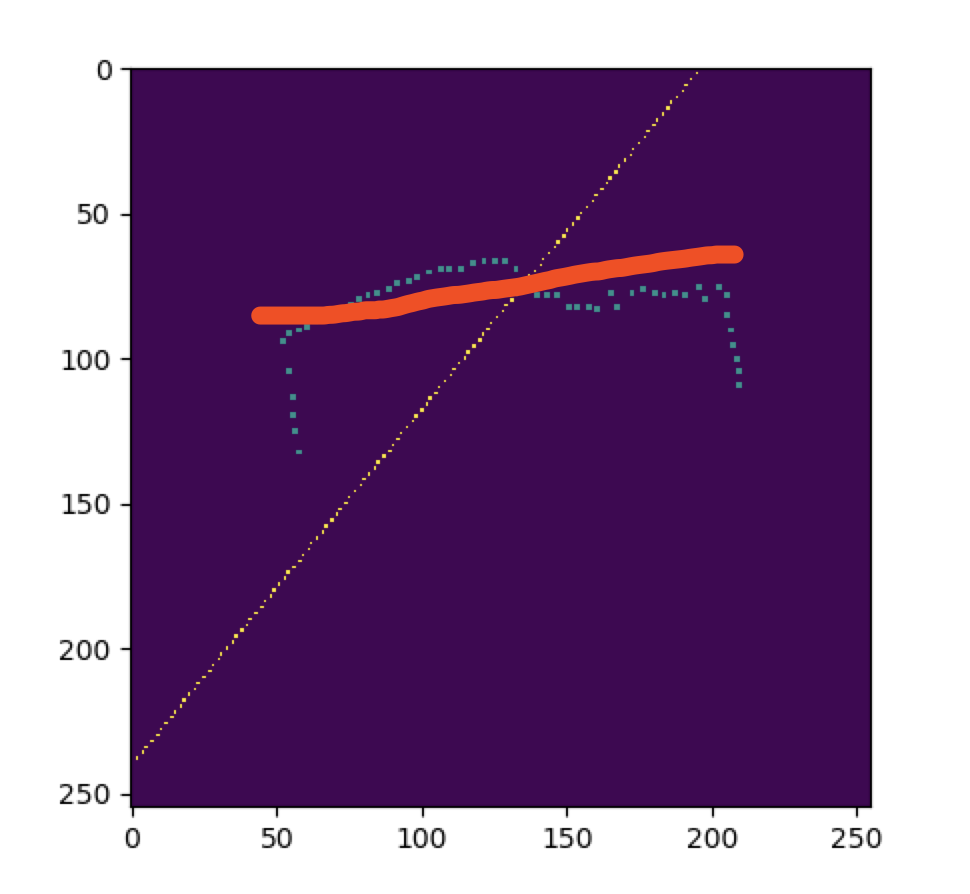
I want to fit a set of points on a 2D plane that looks like the blue points in the following picture. Instead of having a least square fit (the yellow, dotted line), I want a line that looks like the red line that either crosses the blue points as much as possible or is perpendicular to them. How can I achieve this?
-
1$\begingroup$ This seems to be a similar question, ideally you'd get 3 or 4 lines describing your data. $\endgroup$– Marmite BomberCommented Jul 12, 2019 at 4:47
-
1$\begingroup$ If you know in advance you want a line like the red one, why not removing those points near x=50 and x=225? You can treat them as outliers... Then, a obvious question arises, is this a good model for the data? $\endgroup$– ignatiusCommented Jul 12, 2019 at 6:26
3 Answers
I think as suggested in the comments, you should split this up in several linear regressions.
If the datapoints are ordered you could just do repeated linear regressions, always adding one point until the added point leads to a significant reduced goodeness of fit. Then you start the next linear regression until that one goes bad and you start the next one. At the end you can compare the angles between the two lines and see if they are (roughly) 90 degrees.
There are two options in my opinion that might handle this, or you can use create a hybrid of them to reduce computation time.
- With on the shelf algorithms, you might want to try doing a PCA to identify direction for maximum variance, use the first component to define a line or first two components to define a plane (you might end up very close to your idea of the plane). If this doesn't helps then,
Create your own optimization problem to include maximum points. Decide on percentage of points you want the line/ plane to be closer to. pseudo steps for algorithm could look like:
- Initiate parameters defining the plane or line (you might want to warm start using the results from PCA for faster computation)
- set |e| ~ 0.01
- Optimize on plane/ line parameters: Max (no of points in |e| distance of the line/ plane)
- if max points in (3) greater than % points required then stop, else go to (2) and increase |e|
I will suggest following 3 options
- I think your data has some outliers which you want to remove after, that you can still us mean square error cost function
- You may want to define a custom cost function and use auto diff gradient descent to minimize the cost function. One suggestion of cost function is, calculate error of each instance like
$err_i = min((y_i-p_i)^2, err\_clip)$
which will effectively ignore the error greater that err_clip - May be SMV regression will work better with this because it will try to fit as much point between two boundary lines, automatically ignoring the outliers

