3
$\begingroup$

I have a panel data set. My dependent variable is total costs, and almost all of my independent variables are categorical variables. For instance, age is "old","new". Now i have some questions.

  1. Should i use a dummy for all of them? For example, only type variable has 33 values itself, or i can use clustering and reduce them? Or any other way if you know)

  2. Is there a difference in terms of behaviour between categorical variables which have a rank or not? For example type is "A","B",..."S" so no rank between A and B but quality is "A1","A2","A3" which A1 means highest quality.

I don't know why, I can't find enough information about variable selections and making data ready. So now i have lots of variable and I think I should choose between them and also reduse number of dummies.

$\endgroup$
2
  • $\begingroup$ Please explain further on what you want to achieve eventually. I assume you want to build a supervised model to predict the total cost, why is it not possible right now? Do you need to reduce the dimension, perform feature selection? What have you tried already? $\endgroup$ Commented Nov 16, 2019 at 9:31
  • 1
    $\begingroup$ thenks for your comment.yes i want to make a model to predict total cost.because number of categories for some vriables are a lot as i said for only one of them i have 33 factor. not reducing the number of features, i want to reduce number of factors for one special variable.so i will not have lots of dummy variables at the model.i tried model with dummy for all variables and i end of with a model with almost 60 expanetory variable.which it is not good at alll cause i loose predictive power ? @RomainReboulleau $\endgroup$
    – Soma
    Commented Nov 16, 2019 at 9:43

2 Answers 2

2
$\begingroup$

You should convert the categorical variables to dummies. For each individual variable in general you want to have equal number of elements of each class, or at least the numbers should be close. If not, you can cluster smaller classes to form a larger one. For example, let's assume you have a categorical variable with 5 different categories. You want each class to be approximately %20 of the data. If it is not, you can define a new class which combines smaller classes to make each class approximately equal.

For the second part, if you can actually quantify how much A1 is better than A2, or able to assign a relative value to them based on some heuristics; you can convert them to numerical variables.

You can find an example of this in this notebook (section titled "Aggregating categorical variables"). It is from the course "Principles of Machine Learning: R Edition" on edX. You can watch the videos on audit mode for free; and the notebooks are on github.

$\endgroup$
4
  • 1
    $\begingroup$ oh thanks !then my thouts about clustering re not wrong!do you know any method names that can do it for me?(if they are functions in R it is fantastic) $\endgroup$
    – Soma
    Commented Nov 16, 2019 at 9:46
  • 1
    $\begingroup$ and about second one, so if i have an order in categorical variables then i can convert them to numerical variables and act them like numeric in all terms?(correlation and no dummy ..) $\endgroup$
    – Soma
    Commented Nov 16, 2019 at 9:54
  • $\begingroup$ @ssssoooo Check the edit for the first question. And for the second, yes that is what I meant. You can try to see if converting them to numerical values improves your results. $\endgroup$
    – serali
    Commented Nov 16, 2019 at 9:57
  • 1
    $\begingroup$ thank you very much, i completly got my answer :) $\endgroup$
    – Soma
    Commented Nov 16, 2019 at 9:58
2
$\begingroup$
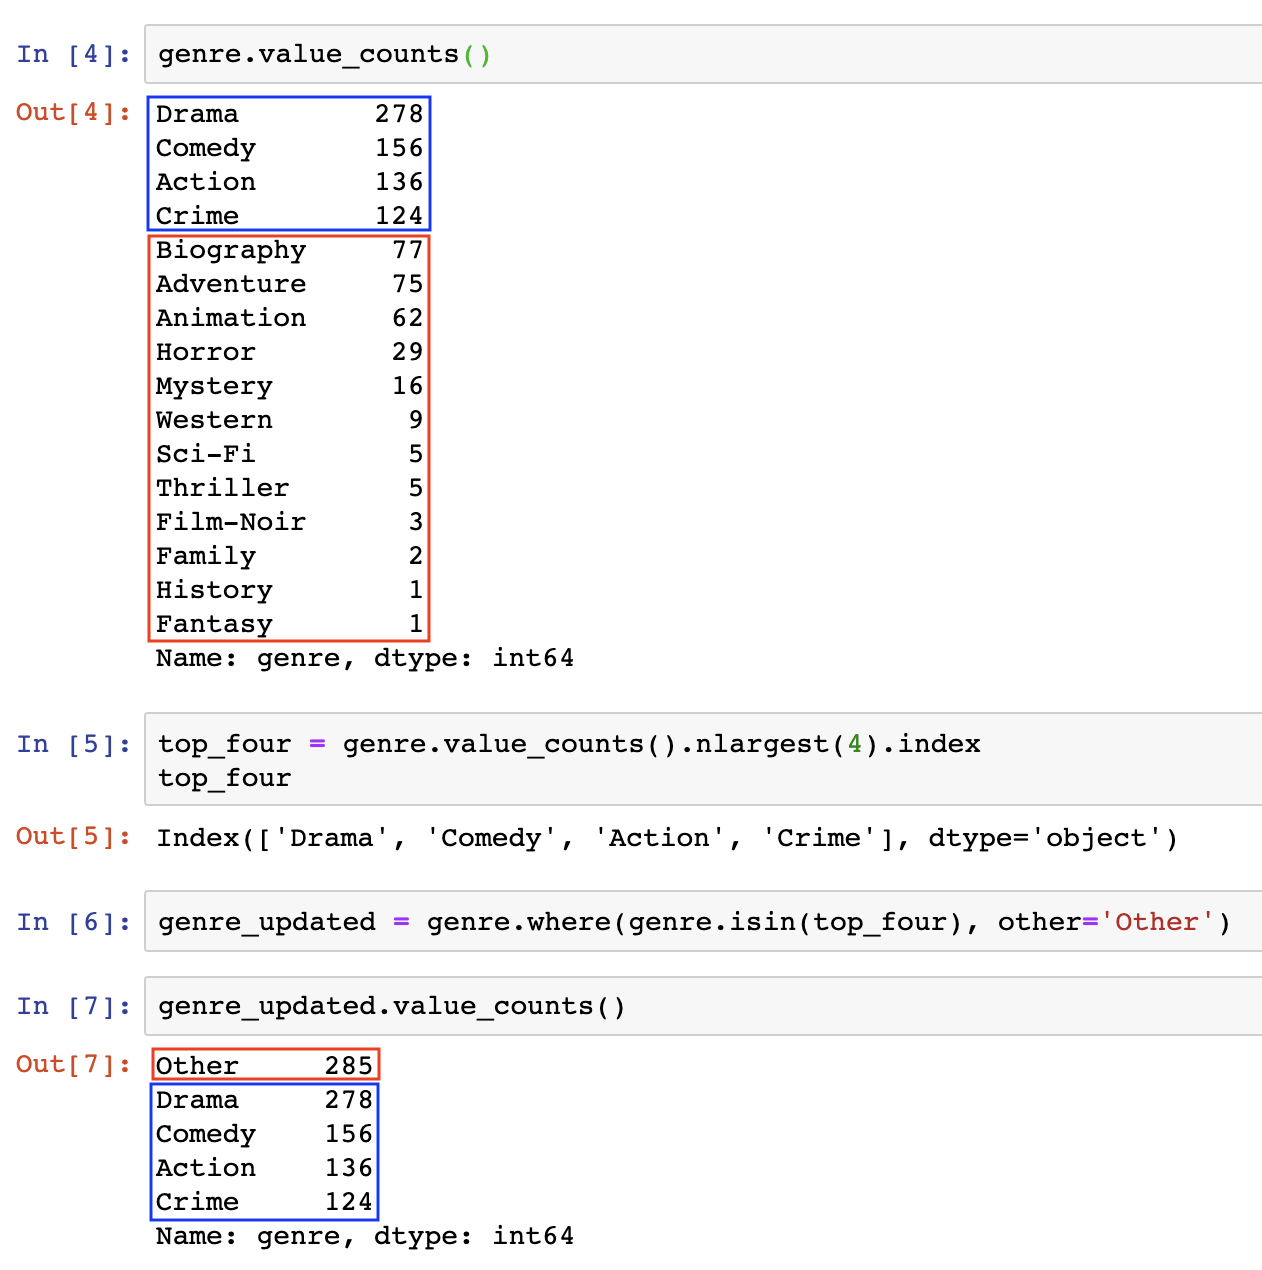
  1. For your problem having 33 variables in the dataset perform a value_counts for those variables.

  2. If you feel the values as you go down are not a lot and hence should not be given a category, you can give them a category of 'OTHER'. Revert to the image below to see how that happens.

  3. You can tweak the parameter of nlargest from 4 to whichever value you find suitable.

enter image description here

  1. If you want to find out the difference between categorical variable and target variable, perform EDA using a library like seaborn

    import seaborn as sns sns.factorplot('categorical_variable_column_name','target_column_name', data=dataframe)

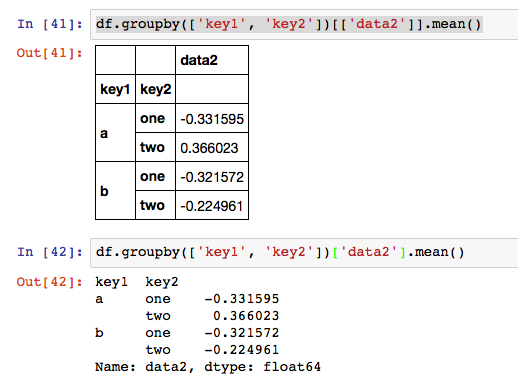
  2. If you don't have seaborn library or just want fast results use aggregate function like :

    dataframe.groupby(['categorcategorical_variable_column_name'])['target_column_name'].mean()

enter image description here

  1. If you find some variables have higher values than other variables like A1>A2>A3 etc. you can assign numeric values in that order itself

    dataframe['categorical_column_name'].str.replace(['A1','A2','A3'],[30,20,10])

  2. You can create dummies for rest of the variables involved, but I would still advice you to use replace using a loop if variables are high in number like A1,A2 ... A33 instead of get_dummies since using get dummies, you'll get very sparse columns through which your model may not learn much from.

$\endgroup$
5
  • 2
    $\begingroup$ oh this a great answer thanks! I already solved my problem according to the first answer. but again thank you.i will definitely use your answer on my next projects. $\endgroup$
    – Soma
    Commented Nov 22, 2019 at 10:23
  • 1
    $\begingroup$ i had some questions after reading it again.1-is there a way to aggregate them buy similarity? 2- how can i count corr between nominal values and my target?(my target is a continues number) $\endgroup$
    – Soma
    Commented Nov 27, 2019 at 19:53
  • $\begingroup$ Regarding your first question I didn't get the question, can you give an example of what you're trying to achieve. And for the second one, you can't find correlation between nominal values and continuous variables since a value is nominal only when it can't be represented by a number. One thing you can do is aggregate your dataframe based on column value -> df.groupby(['nominal_value_column'])['target_column'].mean(). Second thing you can do is convert nominal to numeric by .replace(['a','b','c'],[1,2,3],inplace=True), and then get the correlation using a pythonic inbuilt function, but that... $\endgroup$ Commented Nov 28, 2019 at 6:47
  • $\begingroup$ will be wrong since if they could be converted to numeric, they wouldn't be called nominal. But if you feel they are more on the ordinal side than nominal one, then go ahead and convert it $\endgroup$ Commented Nov 28, 2019 at 6:52
  • 1
    $\begingroup$ about the first question i read about this LASSO fusion to use it on nominal variables and it is not count-based. it is similarity-based i think .i want to use something to categorized them for me based on their type not number. $\endgroup$
    – Soma
    Commented Nov 28, 2019 at 8:54

Your Answer

By clicking “Post Your Answer”, you agree to our terms of service and acknowledge you have read our privacy policy.

Not the answer you're looking for? Browse other questions tagged or ask your own question.