1
$\begingroup$

I am using clustering for my data. Since the DBSCAN algorithm will also tell me an estimate of clusters that I can use, I have used DBSCAN. I have tried for the eps=[0.123,1,2] and min_smaples=[2,10,...60]. The print satatement in the below code prints 714 which is equal to the number of data-samples(rows). The code looks like:

dbscan = DBSCAN(eps=1, min_samples = 4)
clusters = dbscan.fit_predict(df)
print(len(clusters))
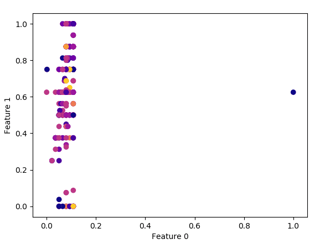
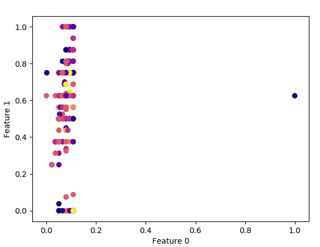
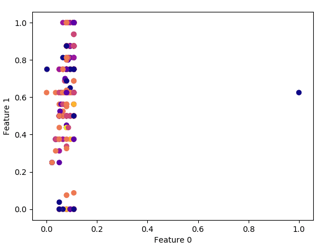
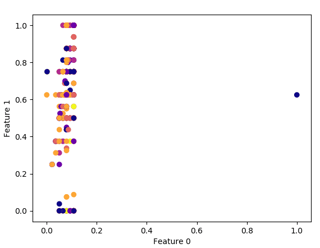
plt.scatter(df.iloc[:, 0], df.iloc[:, 1], c=clusters, cmap="plasma")
plt.xlabel("Feature 0")
plt.ylabel("Feature 1")

Sample plots for some of the different min_samples is shown below:

EPS=1, MIN_SAMPLES=2 enter image description here enter image description here enter image description here

The parameters for the above plots are given below in the same pattern.

  1. EPS=1, MIN_SAMPLES=2, EPS=1, MIN_SAMPLES=10
  2. EPS=1, MIN_SAMPLES=20, EPS=1, MIN_SAMPLES=40

None of these plots are making sense to me from a clustering perspective. From this, I am forced to conclude that I cannot use clustering for the given data or I am doing it wrong. So, I need help with insights into the weird appearance of the above plots.

Any help is appreciated

$\endgroup$

2 Answers 2

2
$\begingroup$

Dont try to visually confirm it.

You are plotting your clustering resutls in ONLY two dimensions and you expect that all of the information is in these two dimesnions. That is very unlikely. If you plot 3 dimensions you will see even more seperability and it will make a bit more sense. In any case you need a metric for example Silhouette that tells you how well you clustered. Visualisation is just a sanity check if you know your features already.

$\endgroup$
4
  • 1
    $\begingroup$ The silhouette score was -0.19. I have used OPTICS also and there is no improvement. So, do I conclude that the data is so close that the model is not able to separate them? K-means also gave a score of 0.17. $\endgroup$
    – Eswar
    Commented Dec 23, 2019 at 13:16
  • $\begingroup$ Well at the moment, there is all sorts of pre-processing, agumentations and transformations that you can use $\endgroup$
    – Noah Weber
    Commented Dec 23, 2019 at 13:27
  • 1
    $\begingroup$ Silhouette does not work for non-convex clusters, and does not handle noise well, hence it is not a good measure to use with DBSCAN. $\endgroup$ Commented Dec 24, 2019 at 7:38
  • $\begingroup$ Can you send me a reference please regarding non-convex $\endgroup$
    – Noah Weber
    Commented Dec 24, 2019 at 8:05
1
$\begingroup$

Don't try to find parameters by brute force.

Instead, analyze your data. The choice of minpts is application driven - how noisy your data is, how many points you require for a point to be considered important. Based on this, you can choose epsilon based on the k-distance plot.

Try projecting your data into different views when you have multiple dimensions.

Also try different preprocessing. You seem to have scaled your data to 0:1, but is this the right scaling to capture similarity? If your distance does not capture similarity, then DBSCAN will not work because it relies on your distance function...

$\endgroup$

Your Answer

By clicking “Post Your Answer”, you agree to our terms of service and acknowledge you have read our privacy policy.

Not the answer you're looking for? Browse other questions tagged or ask your own question.