I am really new to the world of matplotlib graphing as well as using those graphs to understand data.
I have written a simple python code where I read a .csv file in and then store the values of one column into a variable. Then plotting them similar to the code bellow:
dev_x= X   #storing the values of the column to dev_x
plt.plot(dev_x)
plt.title('Data')
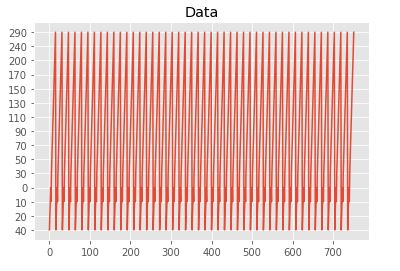
The graph looks like this, which seems quite messy and hard to understand. So, I am asking for some advice on how to make more cohesive graphs.
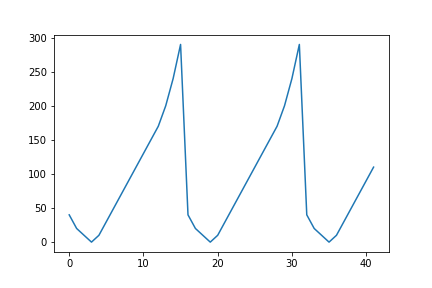
This is what my .csv column looks like. It is just many other other rows.
['40' '20' '10' '0' '10' '30' '50' '70' '90' '110' '130' '150' '170' '200'
 '240' '290' '40' '20' '10' '0' '10' '30' '50' '70' '90' '110' '130' '150'
 '170' '200' '240' '290' '40' '20' '10' '0' '10' '30' '50' '70' '90' '110'
At the end of the day I would like a way to display these in a better way so I can also find the variance of this column.


