2
$\begingroup$

Having n vectors of percentile ranks for a list of common users between group #1 and groups #2:n

e.g. vec1 = {0.25, 0.1, 0.8, 0.75, 0.5, 0.6} vec2 = {0.35, 0.2, 0.6, 0.45, 0.2, 0.9}

The percentile ranks represent activity frequency within the group for instance, opening times. The goal is to find similarity between group #1 and groups #2..n in terms of these common users's rank.

The direction taken so far is to use dot product in order to take the magnitude into account (due to rank). The problem is that the scalar answer can take any value and so a threshold cannot be drawn.

Do I need to draw a threshold with respect to the dot product of vec #1 (group 1) with itself? or is there another way to set a threshold (maybe dynamic) ?

$\endgroup$

2 Answers 2

2
$\begingroup$

As I understand it, you don't want to use the dot product, because it is unbounded. Yet you also don't want to use the cosine similarity metric:

enter image description here

, which is just the dot product normalized by the length of the two vectors being dotted because it does not take magnitude into account e.g. $(1,1)\cdot(1,1)=1=(1,1)\cdot(2,2)$

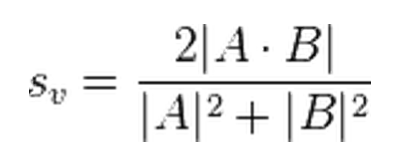
Perhaps you could therefor use the sorensen dice coefficient or possibly 1-soresen:

enter image description here

This varies from 0 to 1 and accounts for magnitudes of the constituent vectors e.g.:

$$s_{\nu}[(1,1),(1,1)]=1$$

, where as

$$s_{\nu}[(1,1),(2,2)]=\frac{4}{5}$$

Hope this helps!

$\endgroup$
6
  • $\begingroup$ I appreciate your reply, I have used this metic however, the drawback here is that the vectors magnitude are not taken into account. For example, similarity of {1,1,1} and {2,2,2} is same is {1,1,1) and {1,1,1} $\endgroup$ Commented Aug 25, 2015 at 17:48
  • $\begingroup$ Check out the Sorensen metric that I added then. I think 1-sorensen will work for you. $\endgroup$
    – AN6U5
    Commented Aug 26, 2015 at 4:02
  • 1
    $\begingroup$ Seems like a great solution!. Tried this solution over the following vectors {0.88,0.60} and {1,0.33} and got similarity of 0.961. By itself this similarity seems to be quite high isn't it? Compared to the similarity obtained by the solution provided by image_doctor the similarity is 0.805. It seems like it is more appropriate, however I am still not sure which method to use. $\endgroup$ Commented Aug 28, 2015 at 11:19
  • $\begingroup$ @image_doctor solution is a good one... its basically Manhattan distance with a percentile based standardization. For that matter, you could also use Euclidean with a percentile or range based standardization. The only drawback of both is that the normalization is very sensitive to outliers. So you have to decide whether you want to prioritize immunity to outliers (i.e. std based standardization) or the enforcement of [0-1]. Sorensen might give the best of both worlds. Note that comparing the raw value between metrics doesn't really make sense. $\endgroup$
    – AN6U5
    Commented Aug 28, 2015 at 11:35
  • $\begingroup$ what do you mean by enforcement of [0-1]. Also what is range based standardization. Anyway I will apply both sorensen and @image_doctor and see if I need to outliers are important or not $\endgroup$ Commented Aug 29, 2015 at 9:18
0
$\begingroup$

As you are using percentile values, your vector components are effectively normalised on the interval $[0,1]$. As a result the element wise subtraction of components, normalised by the number of components in the vector, will give you a bounded similarity value between 0 and 1.

So for two vectors $x$ and $y$ of length $n$, similarity can be computed thus:

$$S(x,y)=1-\frac{1}{n}\sum_{i=1}^n{\lvert x_i-y_i\lvert}$$

You can refine this approach by taking account of the variance for each component within the vector and standardising this around 0.5.

$\endgroup$
3
  • $\begingroup$ This solution has two issues I can see. 1, since the diff is not squared as for sum of square errors, so errors with opposite direction will cancel each other. In addition, correct me if wrong, this solution does not take into account unique positons of vector elements in case this important $\endgroup$ Commented Aug 26, 2015 at 19:24
  • $\begingroup$ Good point about forgetting to add Abs ! What is unique about the positions of the vector elements ? If you wanted a weighted sum of similarities something would have to determine that weighting. Is there any any information on that ? Or would you want to apply a machine learning approach to the weighting scheme ? $\endgroup$ Commented Aug 26, 2015 at 19:54
  • $\begingroup$ disregard the issue with unique position. Regarding the weighting, so far I dont see reason to apply that, anyway that is a great point to keep in mind $\endgroup$ Commented Aug 29, 2015 at 9:19

Your Answer

By clicking “Post Your Answer”, you agree to our terms of service and acknowledge you have read our privacy policy.

Not the answer you're looking for? Browse other questions tagged or ask your own question.