0
$\begingroup$

it has come to my understanding, that a value of K=1, gives a high variance because we are only using only one data point, hence we are very likely to model the noise in that training example.


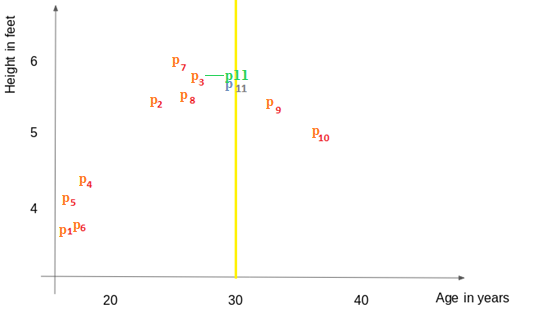
Bias: It will take the value of point 3 as it’s the closest one. It looks much better here (I know not the best example but you can consider another example such as house price and axis to be locality and price). It makes more sense that the point will be similar to the closest points compare to the point far away.


Variance: Let’s say point 11 was at age 32, then the closest point would have been 9 and hence the new predicted value would have been much different than the current one. Hence, it has a high variance.


They used a different data point from the test data, but why is point 11, at age 32?, what makes for the two data points to be related, because surely if I use age 50, I do not expect a prediction close to the prediction at age 30, do they assume they have the same height, if then, why are we using our dependent variable to predict our dependent variable

Can someone provide me answers


Much appreciated


Graph of Height in Feet against age

$\endgroup$

1 Answer 1

0
$\begingroup$

It's just an example in the article trying to make the point that a small change with regards to the age of $p_{11}$ from $30$ to $32$ has relatively large impact on the prediction since with $k=1$ for

  • $age_{p_{11}}=30$, the model would predict $heigth_{p_{11}}\leftarrow heigth_{p_{3}}$ and for
  • $age_{p_{11}}=32$, the model would predict $heigth_{p_{11}}\leftarrow heigth_{p_{9}}$.

Moving $p_{11}$ to $age = 50$ would just not serve as a good example for the case they are making because it's not surprising that a model predicts different height values for $age=30$ and $age=50$.

To phrase it differently, the relation between $p_{11}$ being at $age=30$ or $age=32$ is that it's only a small difference in terms of age.

$\endgroup$
1
  • $\begingroup$ Thank you, I figured it meant a small fluctuation in training data gives a completely different prediction hence high variance $\endgroup$ Commented May 13, 2021 at 20:10

Your Answer

By clicking “Post Your Answer”, you agree to our terms of service and acknowledge you have read our privacy policy.

Not the answer you're looking for? Browse other questions tagged or ask your own question.