18
$\begingroup$

I have sparse features which are predictive, also I have some dense features which are also predictive. I need to combine these features together to improve the overall performance of the classifier.

Now, the thing is when I try to combine these together, the dense features tend to dominate more over sparse features, hence giving only 1% improvement in AUC compared to model with only dense features.

Has somebody come across similar problems? Really appreciate the inputs, kind of stuck. I have already tried lot of different classifiers, combination of classifiers, feature transformations and processing with different algorithms.

Thanks in advance for the help.

Edit:

I have already tried the suggestions which are given in the comments. What I have observed is, for almost 45% of the data, sparse features perform really well, I get the AUC of around 0.9 with only sparse features, but for the remaining ones dense features perform well with AUC of around 0.75. I kind of tried separating out these datasets, but I get the AUC of 0.6, so, I can't simply train a model and decide which features to use.

Regarding the code snippet, I have tried out so many things, that I am not sure what exactly to share :(

$\endgroup$
6
  • $\begingroup$ How sparse are your features? Are they 1% filled or even less? $\endgroup$ Commented Apr 6, 2016 at 12:35
  • 2
    $\begingroup$ Also you should note that if your features are sparse then they should only help classify a small part of your dataset, which means overall the accuracy shouldn't change significantly. This is kind of a guess, as I don't know what are the characteristics of your dataset. $\endgroup$ Commented Apr 6, 2016 at 12:40
  • $\begingroup$ @JoãoAlmeida They are not that sparse. They are around 5% filled. The problem is when I look at the difference in the predictions from two models, where the predictions differ, model with sparse features tend to perform better, that's why I expected it to see the boost in AUC as well when I combined them with dense features. I am getting a boost, but seems very low. $\endgroup$ Commented Apr 7, 2016 at 10:46
  • $\begingroup$ hum... I don't have any idea for you then $\endgroup$ Commented Apr 7, 2016 at 10:51
  • $\begingroup$ i met the same problem, maybe simply put dense and sparse feature in a single model is not a good choice. maybe you can try wide and deep model. wide for sparse features and deep for dense features, if you tried this method, please tell me the answer. $\endgroup$
    – Jianye Ji
    Commented Apr 12, 2019 at 4:02

5 Answers 5

6
$\begingroup$

This seems like a job for Principal Component Analysis. In Scikit is PCA implemented well and it helped me many times.

PCA, in a certain way, combines your features. By limiting the number of components, you fetch your model with noise-less data (in the best case). Because your model is as good as your data are.

Consider below a simple example.

from sklearn.pipeline import Pipeline
pipe_rf = Pipeline([('pca', PCA(n_components=80)),
                    ('clf',RandomForestClassifier(n_estimators=100))])
pipe_rf.fit(X_train_s,y_train_s)

pred = pipe_rf.predict(X_test)

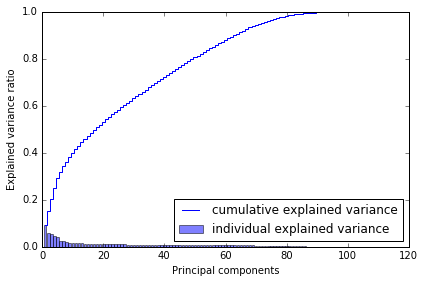
Why I picked 80? When I plot cumulative variance, I got this below, which tells me that with ~80 components, I reach almost all the variance. cumulative variance

So I would say give it a try, use it in your models. It should help.

$\endgroup$
4
+25
$\begingroup$

The best way to combine features is through ensemble methods. Basically there are three different methods: bagging, boosting and stacking. You can either use Adabbost augmented with feature selection (in this consider both sparse and dense features) or stacking based (random feature - random subspace) I prefer the second option you can train a set of base learners ( decisions. Trees) by using random subsets and random feature ( keep training base learners until you cover the whole set of features) The next step is to test the Training set to generate the meta data. Use this meta data to train a meta classifier. The meta classifier will figure out which feature is more important and what kind of relationship should be utilized

$\endgroup$
3
  • $\begingroup$ Can you please share the relevant documentation? Didn't exactly get you what you meant? $\endgroup$ Commented Apr 13, 2016 at 6:04
  • $\begingroup$ You can read an article about staking " issues in stacking techniques, 1999" read about stackingC . It is very important to know that I am talking about the whole vector (e.g. 1x36 in case of Hog) as a one feature, but not the dimensions within it. You need to track which feature used with which base learner. Be careful about the overfitting problem $\endgroup$ Commented Apr 13, 2016 at 16:15
  • $\begingroup$ If you give more details about the database , number of classes, number of samples , code , what things you have tried , what things you noticed, do you have data imbalance problem, noisy samples ,... Etc . All these details are important and can help in selecting the best method. Give me more details if this ok and I may help in a better way $\endgroup$ Commented Apr 13, 2016 at 16:19
1
$\begingroup$

The variable groups may be multicollinear or the conversion between sparse and dense might go wrong. Have you thought about using a voting classifier/ ensemble classification? http://scikit-learn.org/stable/modules/ensemble.html That way you could deal with both above problems.

$\endgroup$
7
  • $\begingroup$ I have already tried out the ensemble techniques as well as voting classifiers. Still no luck. $\endgroup$ Commented Apr 12, 2016 at 8:15
  • $\begingroup$ So do you see a lot of overlap then between the predictions from the two datasets? May be there indeed is no new information? I.e. the data tells the same story. $\endgroup$
    – Diego
    Commented Apr 12, 2016 at 9:20
  • $\begingroup$ yes, I have done exactly that. Though the predictions are not entirely different, the number of samples where predictions differ are quite high (around 15-20%) of the data. For these samples model with sparse features performs better than that of model with dense features. My point is if sparse features perform better, why don't they come as important features in any of the models which I have tried so far. $\endgroup$ Commented Apr 12, 2016 at 9:31
  • $\begingroup$ What predictor algorithm do you use? $\endgroup$
    – Diego
    Commented Apr 12, 2016 at 12:21
  • $\begingroup$ I have tried out quite a few algorithms and settled on Gradient Boosted Model, also I do use Random Forests quite a lot for my problem. $\endgroup$ Commented Apr 12, 2016 at 17:27
1
$\begingroup$

In addition to some of the suggestions above, I would recommend using a two-step modeling approach.

  1. Use the sparse features first and develop the best model.
  2. Calculate the predicted probability from that model.
  3. Feed that probability estimate into the second model (as an input feature), which would incorporate the dense features. In other words, use all dense features and the probability estimate for building the second model.
  4. The final classification will then be based on the second model.
$\endgroup$
1
$\begingroup$

Try PCA only on sparse features, and combine PCA output with dense features.

So you'll get dense set of (original) features + dense set of features (which were originally sparse).

+1 for the question. Please update us with the results.

$\endgroup$
3
  • $\begingroup$ Wow, this has actually brought down AUC :( Not sure, what it means, need to check the feature importance and all. But my philosophy is, out of around 2.3k sparse features, I used 1k features which were explaining 0.97 variance ratio, this loss of information may have brought down AUC. $\endgroup$ Commented Apr 18, 2016 at 10:17
  • $\begingroup$ Interesting. Thanks for sharing. We have very similar dataset to yours (1k-2k sparse features). Just out of curiosity, how many principal componenets you have generated? If that number is too low, this may explain why AUC went down. $\endgroup$
    – Tagar
    Commented Apr 18, 2016 at 15:22
  • $\begingroup$ As I said already, I have generated 1k principal components which were explaining 0.97 variance. $\endgroup$ Commented Apr 18, 2016 at 17:55

Your Answer

By clicking “Post Your Answer”, you agree to our terms of service and acknowledge you have read our privacy policy.

Not the answer you're looking for? Browse other questions tagged or ask your own question.