1
$\begingroup$

I am new to this forum and to field of machine learning. My apologies if this is a trivial question already answered previously.

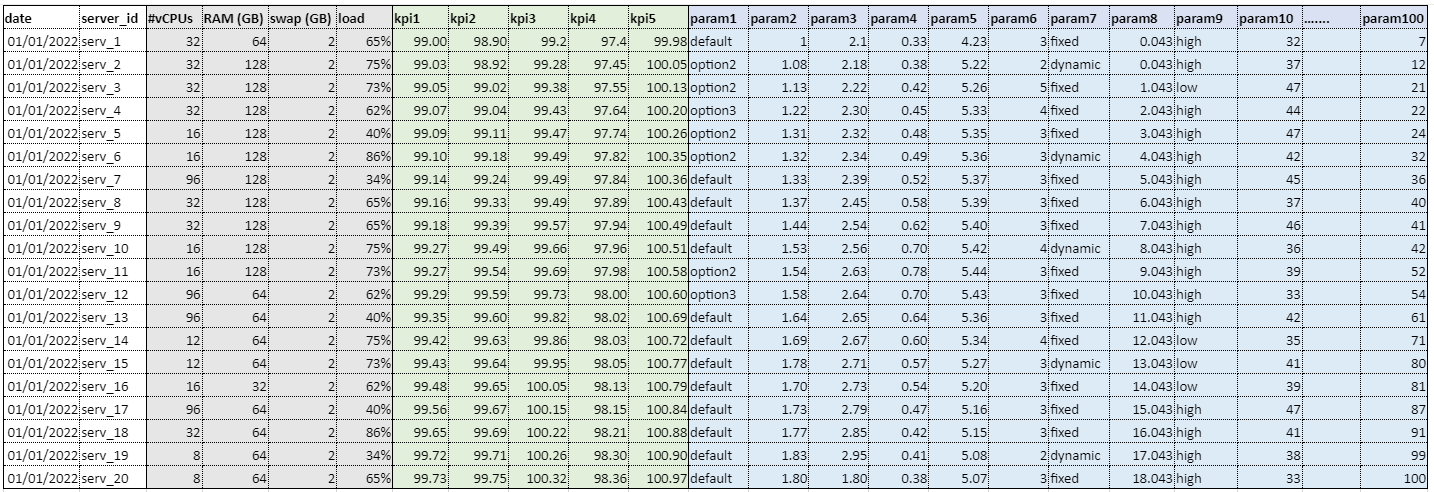
I have a set of approximately 20 servers. Each server's performance is dependent on the its hardware configuration, the parameter settings used to configure the server (these are often changed to keep the servers performaing properly - there are ~100 or so) and the server's CPU load which is dependent on user activity.

Below is a mock-up version of my data

enter image description here

The task at hand is to predict reason(s) for key performance indicator(s) deterioration, if/when it occurs. So, for example if KPI1 for server_1 suddenly goes bad, I would like to attribute reasons for the same, such as "due to a change in parameter_1" (obviously poor choice of parameter setting) and/or sudden increase in "load" and/or Current capacity exceeded for hardware configuration.

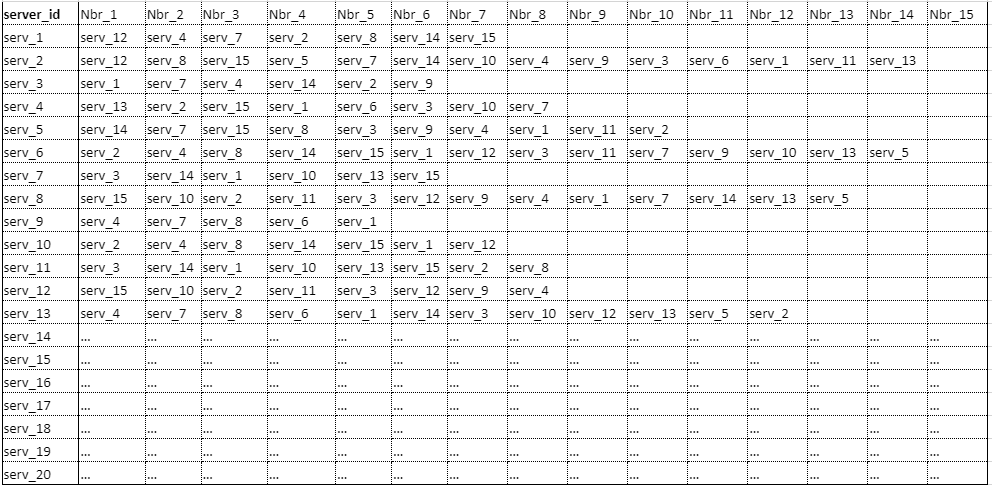
Relationship Most importantly each server has a relationship with certain other servers (referred to as neighbouring servers) which might also impact its own performance. For example, serv_1 could be a neighbour of serv_12, 4, 7 etc. If for some reason the performance of serv_4 deteriorates, it could in turn impact the performance of serv_1.

enter image description here

I would like to request guidance - just so that I get off to a reasonable start.

$\endgroup$

1 Answer 1

1
$\begingroup$

I suggest Random Forest for a start because it classifies many cases automatically so that you can see what is going on with your data with good accuracy.

This is a relatively robust algorithm compared to classic tree classification thanks to its bootstrap aggregating algorithm.

Here is a notebook example to implement RF:

https://www.kaggle.com/code/patrickaudriaz/random-forests-for-multiclass-classification/notebook

$\endgroup$
3
  • $\begingroup$ Hi Nicolas, thank you for your response. In my case I have a set of targets that are continous in nature (can range from 0 through 100), each of which are influenced by a given set of features. If I were to break down my question in terms of complexity, I would rephrase to ask : if it is possible to determine features that have negatively influenced the target (for which reason it is deemed an anomaly). $\endgroup$ Commented Sep 19, 2022 at 16:24
  • 1
    $\begingroup$ Do you mean whether features are correlated or not? Anti-correlated is a good thing because it is an inverse correlation, but features with correlations around 0 should be removed. seaborn.pydata.org/examples/many_pairwise_correlations.html $\endgroup$ Commented Sep 19, 2022 at 17:55
  • $\begingroup$ Does it answer your question? If not, please let me know. $\endgroup$ Commented Sep 22, 2022 at 7:34

Your Answer

By clicking “Post Your Answer”, you agree to our terms of service and acknowledge you have read our privacy policy.

Not the answer you're looking for? Browse other questions tagged or ask your own question.