3
$\begingroup$

So, I've been trying to implement my first algorithm to predict the (sales/month) of a single product, I've been using linear regression since that was what were recommended to me. I'm using data from the past 42 months, being the first 34 months as training set, and the remaining 8 as validation.

I've been trying to use 4 features to start:

  • Month number(1~12)
  • Average price that the product was sold during that month
  • Number of devolutions previous month
  • Number of units sold previous month

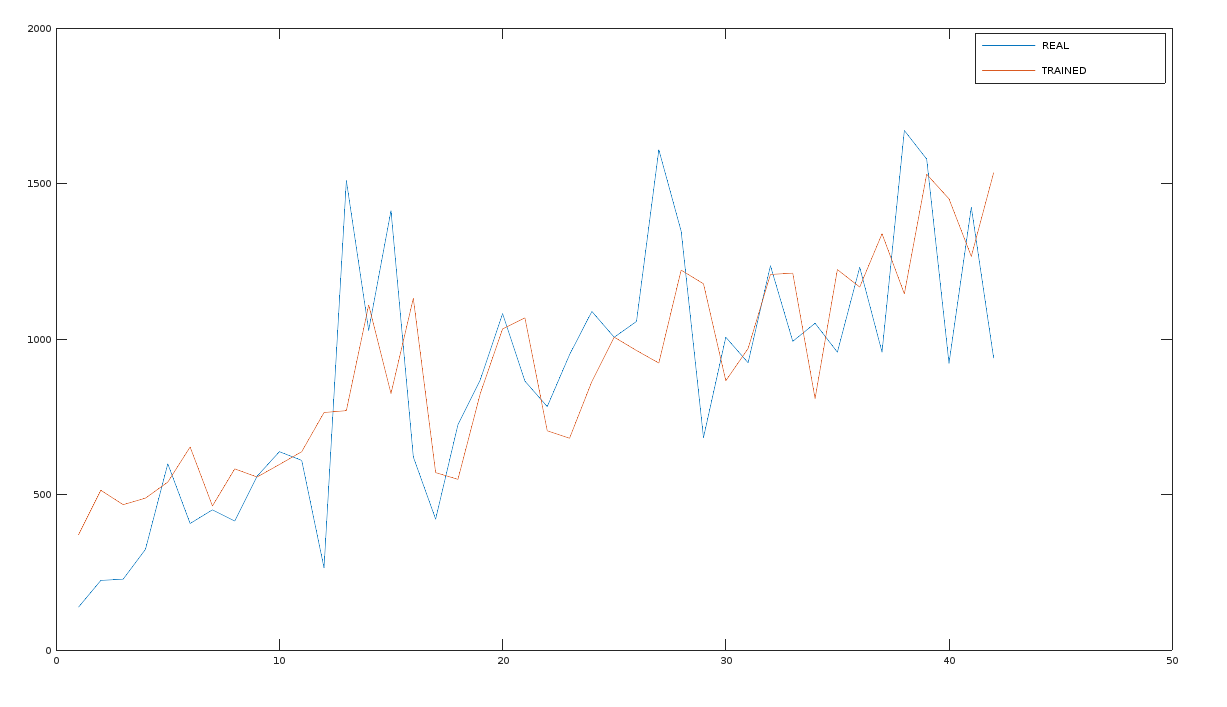
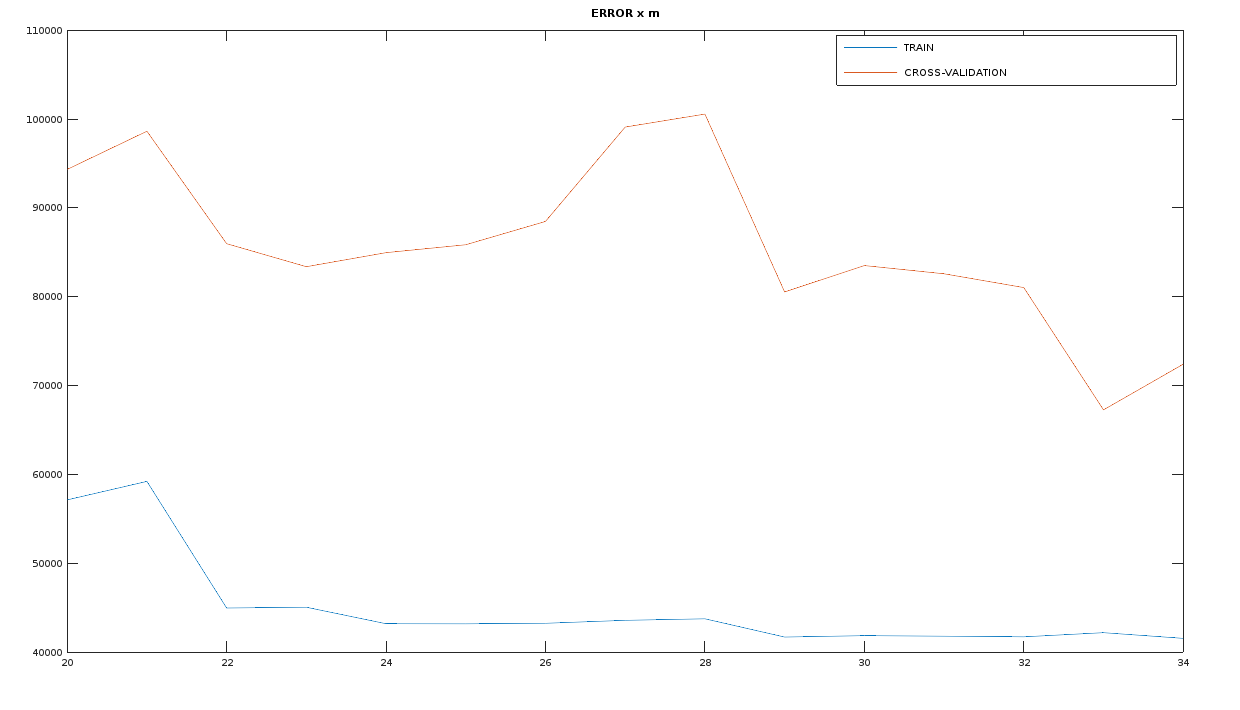
Here are images with graphs comparing the Real Data x Predicted Data and a Error x number of elements graph:

Real Data x Trained Data Error x Number of trained elements

So far the results are not good at all (as shown in the images above), the algorithm can't even get the training set right. I tried to use higher degrees polynomials, and the regularization parameter, it seems to make it worse.

Then, I would like to know if there is a better approach for this problem, or what could I do to improve the performance.

Thanks a lot in advance!

$\endgroup$

2 Answers 2

2
$\begingroup$

Based on the information given by you. I'm assuming you have performed multiple linear regression ie multiple features and one response feature to be predicted.

First, apply PCA on all of your features except the response variable you want to predict. In your case the four features you mentioned. Then transform it into a 2 component matrix using PCA. Once you are done with that plot the new Matrix you formed with the response features as a scatter plot.So effectively a 3D scatter plot.

When you generate this scatter plot you will be able to visualize much better on which regression you have to use. You can decide for yourself if it is linear or not. Depending on how many outliers you are comfortable with.

$\endgroup$
2
  • $\begingroup$ Sorry for the noob question, but after applying PCA it seems that most of the data follows the same plane, would the ideal regression model be indeed linear? $\endgroup$
    – Lucas
    Commented Mar 24, 2017 at 16:00
  • $\begingroup$ Yes. If the scatter plot puts all the data points on a plane then it is linear. Linear = Line (1D). A line in 2D is a plane. Hence your data is linear. According to what you just said. $\endgroup$
    – user-116
    Commented Mar 24, 2017 at 16:04
1
$\begingroup$

Based on the data seen in your graphs, according to me, this is a time series modelling problem and a model like ARIMA (Autoregressive Integrated Moving Model Average) would be a better fit.

Since you mentioned that you're starting (you've probably done a lot by now) here's a tutorial by Dr Jason Brownlee on implementing ARIMA on Python: ARIMA for time series forecasting with Python. This is for in sample prediction, where you want to predict values for which you already have to test the model.

For out of sample Prediction see: Time Series ARIMA model for forecasting with Python

$\endgroup$

Your Answer

By clicking “Post Your Answer”, you agree to our terms of service and acknowledge you have read our privacy policy.

Not the answer you're looking for? Browse other questions tagged or ask your own question.