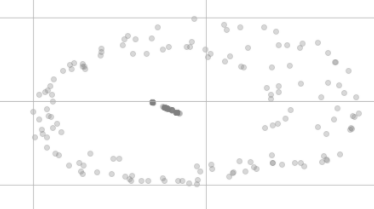
You're correct that the same values in T-SNE can be distributed across different points, the reason this happens is clear if you take a look at the algorithm that T-SNE runs across.
To address your first concern about the points actually not being the same after the algorithm has been applied to the dataset. I will leave you with an exercise to verify it for yourself, consider a simple array $x_1 =
[0,1]$ and $x_2 = [0,1]$ and run actual algorithm against it and see for yourself that the resultant points are not actually identical.You can cross reference your answer against this.
import numpy as np
 from sklearn.manifold import TSNE
 m = TSNE(n_components=2, random_state=0)
 m.fit_transform(np.array([[0,1],[0,1]]))
You'd also observe that changing the random_state actually modifies the output co-ordinates of the model. There isn't any real correlation between the actual co-ordinates and their output. Since the first step of TSNE computes the conditional likelihood.
Let us now try to rationalize, using the algorithm the reason this happens, just using math, without any intuition, for the moment. Note, that $x_i$ and $x_j$ are both vectors in this situation. $p_{j | i} = \frac{exp(\frac{-||x_j - x_i||^2}{2\sigma^2})}{\sum_{k \neq i}{exp(\frac{-||x_j - x_i||^2}{2\sigma^2})}}$. Now, if we calculate the $p_{ij} = \frac{p_{i|j} + p_{j | i}}{2N}$, we can see that the value is 1. After applying KL divergence, we obtain the values stated above. Now, let us apply some intuition to this. $p_{ij}$ is, informally, the conditional probability that $x_i$ would pick $x_j$ as it's neighbor. This justifies the result, 1, for two reasons. The first, being that there is no other neighbor, so it must pick the only other vector in the list of co-ordinates. In addition, the points are identical and the chances that they are picked as the others neighbor should be high, as we see.
Now coming to whether the absolute co-ordinates in $\mathbb{R}^2$ have any significance. They really don't. The randomness can redistribute the points wherever you want them to go. However, what is more interesting is the ratios of the distances between the points and these are relative and are relative even when we project it onto higher dimensions which is pretty interesting.
So, the truth is, rather than looking at the two clusters, look at the distances between them, because that conveys more information than the co-ordinates themselves.
Hope this answered your question :)

