I have no idea where to start when it come to cluster distribution and finding out similar the similar one. Is there a package in R that does the job?
3 Answers
There are quite a few ways to measure the difference between two distributions. Take a look at this overview article on wikipedia.
One very common way that is used often in Machine and Deep Learning is the Kullback-Leibler (KL) Divergence. It is most commonly used in minimising the cross-entropy between the distribution of your training data and the expected (generalised) distribution of the problem you are analysing. In general, a value close to 0 indicates that two distributions are expected to show similar behaviour, while a large value indicates the distributions behave very differently - so knowing the first distribution doesn't help you know anything about the second.
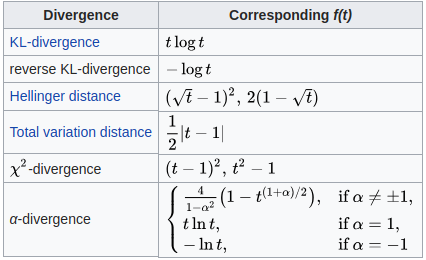
A more general class of measures of dissimilarity between distributions is the so called $f$-divergence, "an average, weighted by the function $f$ of the odds ratio given by [probability measures] $P$ and $Q$". The Wikipedia article contains a formal definition and a table with functions $f$ that give some popular dissimilarities/distances, including the KL-divergence.
The following table lists many of the common divergences between probability distributions and the $f$ function to which they correspond (cf. Liese & Vajda (2006))
KL-Divergence is combined with the entropy itself, to define the cross-entropy. Take a look here, under the Information Theory View, for a bit more info.
Use the popular K-means clustering algorithm combined with Hellinger distance as a metric of distance.
Hellinger distance quantifies the similarity between two distributions / histograms, thus it can be very easily merged with K-means for your purpose :)
-
$\begingroup$ Can you say anything more about why you recommend the Hellinger distance (as opposed to any other distance metric)? $\endgroup$– D.W.Commented Jun 12, 2018 at 23:13
-
$\begingroup$ to be honest I am more biased towards it because of some publications I have been recently reading that explicitly used it, such as this one link.springer.com/article/10.1007/s10618-017-0538-6. I don't recommend it over other metrics, I suggested it as a starting point because OP said he has no idea where to start and it is actually a concrete starting point when combined with K-means for his problem :) $\endgroup$– pcko1Commented Jun 12, 2018 at 23:21
-
$\begingroup$ actually, from the publication I cited above: "It is a proper metric, it is quick to compute and it has no problem with empty bins". Hope it helps ! $\endgroup$– pcko1Commented Jun 12, 2018 at 23:23
Install the broom package, and read the vignettes, especially "kmeans with dplyr and broom". This vignette contains a long, concise, worked example that might give you a head-start.
The broom package summarizes key information about statistical objects in tidy dataframes. This makes it easy to report results, create plots and consistently work with large numbers of models at once.

