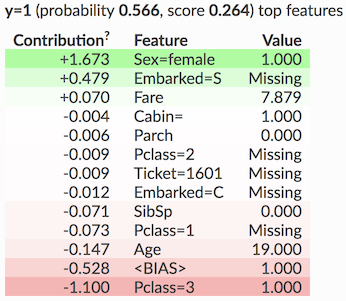
I suggest you to go for Shap.
It uses the Shapley values (concept borrowed from the Game Theory) to describe the model behavior, and with that it can explain a single prediction.
It's graphical interface uses Force Plots, like the one that you see below. 
The red bar is built by the features that lead the prediction to positive values, and the blue by the other ones.
In your case (a classifier) the number in bold will be the one just before the sigmoid function that will limit the output value between zero and one (one class or the other). So don't be scared if in some cases it will be greater than one, or negative.
The size of the segments represent how much that feature contribute to the prediction, and under the segments you see the name of the feature (ex. LSTAT) and it's actual value (ex. 4.98). So, in this case, LSTAT is the mean feature that lead the prediction for that element of the dataset to the value of 24.41 (the number in bold).
Enjoy!


