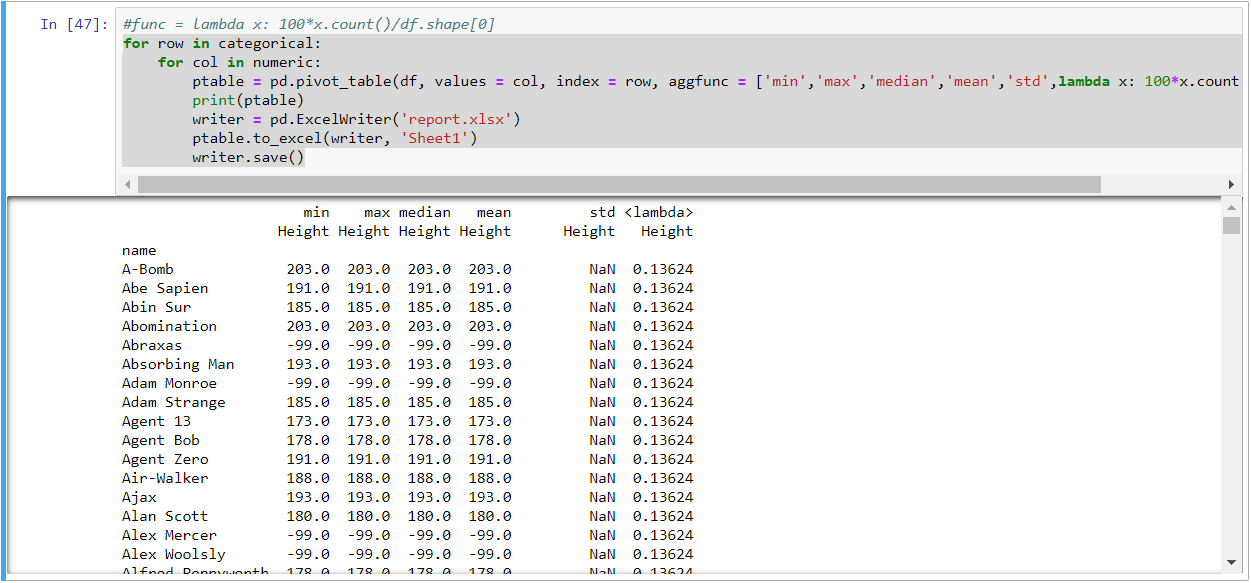
The following is a piece of code I wrote to create a pivot table for categorical vs continuous variable.
for row in categorical:
    for col in numeric:
        ptable = pd.pivot_table(df, values = col, index = row, aggfunc = ['min','max','median','mean','std',lambda x: 100*x.count()/df.shape[0]])
        print(ptable)
        writer = pd.ExcelWriter('report.xlsx')
        ptable.to_excel(writer, 'Sheet1')
        writer.save()
It displays the output as in the image:
but this is not a data frame and when writing into an excel file it displays only the last iteration values.

how do I get all the iterated tables into the excel file or separate excel files?
