6
$\begingroup$

I try to do normal classification on high dimensional traditional columnar data (several hundred columns). The features are of different type. In this case, it's clearly out of question to examine each features one by one to figure out what are they exactly and what optimization or feature engineering could be done with them.

Still, I have to do all the necessary preprocessing steps like imputation, standardization etc. But even such basic steps like categorical feature encoding or imputation are problematic because R/Python-pandas are sometimes wrongly recognized the numeric/categorical nature of some variables (and as a consequence, wrongly try to encode or mean-impute the NAs), not to mention other very problematic issues that could be handled if one could oversee the features one by one.

Of course, I could turn to models which are capable of handling non-standardized features with NAs but this limits the number of possible models on one hand and seems me very unprofessional on the other hand. What is the way to get over this issue?

$\endgroup$
3
  • $\begingroup$ What do you mean by NAs? $\endgroup$ Commented Sep 8, 2018 at 9:45
  • $\begingroup$ @Media NA: missing values $\endgroup$
    – user12075
    Commented Sep 8, 2018 at 15:03
  • $\begingroup$ In my opinion, this is a big problem: "R/Python-pandas are sometimes wrongly recognized the numeric/categorical nature of some variables". If you cannot even specify correctly whether variables are numeric or categorical, then I don't see how you can expect any automatic algorithm to help you. To me, that is the absolute bare minimum to do any kind of automated feature engineering. $\endgroup$
    – Tripartio
    Commented Jan 8, 2023 at 13:47

3 Answers 3

4
$\begingroup$

There are 4 ways I know in Python. In the following I copied the code I wrote for regression purposes. Classification would be very similar :

First: SelectKBest:

from sklearn.feature_selection import SelectKBest, f_regression
train_data = train_data.apply(pd.to_numeric).astype('float32')

kb = SelectKBest(score_func=f_regression, k=70)
kb.fit(train_data.loc[:, train_data.columns != 'SalePriceLog'], train_data.SalePriceLog)
indices = np.argsort(kb.scores_)[::-1]
selected_features = []
for i in range(5):
  selected_features.append(train_data.columns[indices[i]])
plt.figure()
plt.bar(selected_features, kb.scores_[indices[range(5)]], color='r', align='center')
plt.xticks(rotation=45)

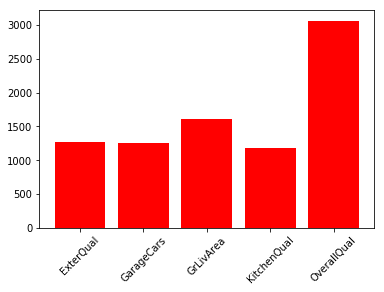
results: enter image description here

Second: RFE

 from sklearn.linear_model import LogisticRegression, LinearRegression
    from sklearn.feature_selection import RFE
    model = LinearRegression()
    rfe = RFE(model, 10)
    fit_rfe = rfe.fit(train_data.loc[:, train_data.columns != 'SalePriceLog'], train_data.SalePriceLog)
indices_rfe = np.argsort(fit_rfe.ranking_)
selected_features_rfe = []
for i in range(10):
    selected_features_rfe.append(train_data.columns[indices_rfe[i]])
selected_features_rfe
plt.figure()
plt.bar(selected_features_rfe, fit_rfe.ranking_[indices[range(10)]], color='r', align='center')
plt.xticks(rotation=45)

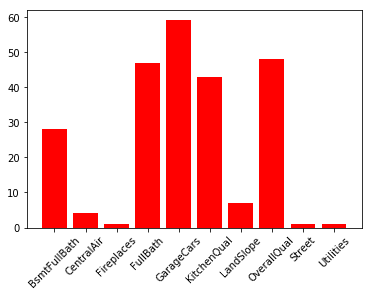
results:enter image description here

Third: PCA

from sklearn.decomposition import PCA
# pca = PCA(n_components=5)
pca = PCA(0.999)
fit = pca.fit(train_data.loc[:, train_data.columns != 'SalePriceLog'])

Fourth: ExtraTrees

from sklearn.ensemble import ExtraTreesRegressor

model_extra_tree = ExtraTreesRegressor()
model_extra_tree.fit(train_data.loc[:, train_data.columns != 'SalePriceLog'], train_data.SalePriceLog)
indices_extra_tree = np.argsort(model_extra_tree.feature_importances_)[::-1]
selected_feature_extra_tree = []
for i in range(10):
    selected_feature_extra_tree.append(train_data.columns[indices_extra_tree[i]])
plt.figure
plt.bar(selected_feature_extra_tree, model_extra_tree.feature_importances_[indices_extra_tree[range(10)]])
plt.xticks(rotation=45)

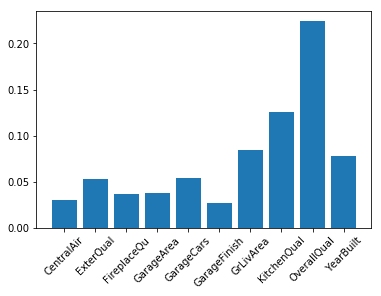
results:enter image description here

$\endgroup$
0
$\begingroup$

I think you should first check the correlations between the features which tells you which of these features can be neglected if you are not done with this step first. This will reduce features dimensionality to some extent by not selecting the features which are dependent on others.

$\endgroup$
0
$\begingroup$

There are numerous things that you can do. I suggest two things that are very plausible.

  1. Try to use PCA. Although it is linear, you have the flexibility to reduce the number of features and investigate how much information you are losing.
  2. Try to find the correlation between each feature and the output. If they are uncorrelated, you might think of ignoring the feature. But beware of cross-features. Eg: It maybe the case that your underlying data is like:
F1 F2 L
A  X  1
A  Y  0
B  X  0
B  Y  1

Now, F1 and F2 individually are uncorrelated with the data, but together they determine the label completely.

Although you have too many features, it can be done automatically.

$\endgroup$

Your Answer

By clicking “Post Your Answer”, you agree to our terms of service and acknowledge you have read our privacy policy.

Not the answer you're looking for? Browse other questions tagged or ask your own question.