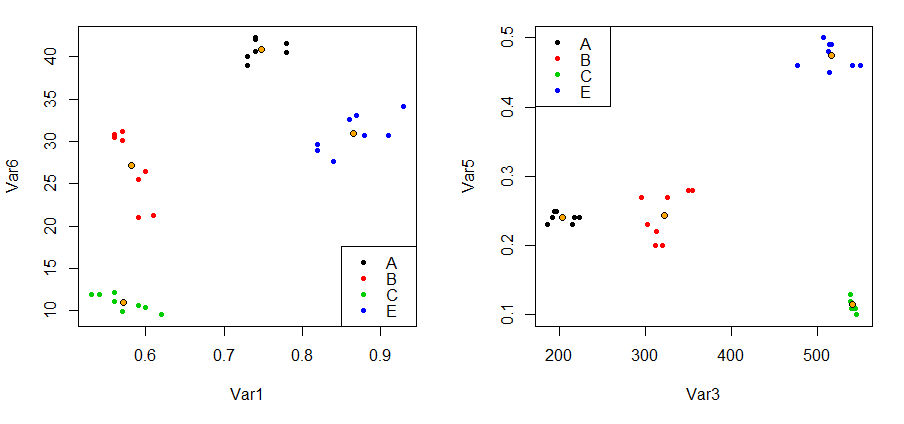
I have data as shown below. Like the groups shown A,B,C.. there are roughly 5400 groups of data and 15 observations for every group (I sampled 6-7 for each group and pasted them here).
Grp    Var1    Var2    Var3    Var4    Var5    Var6    Var7
   A    0.74    0.02    196.75  0.11    0.25    42.26   1.00
   A    0.73    0.02    194.25  0.12    0.25    38.94   1.00
   A    0.74    0.01    191.05  0.12    0.24    40.66   1.00
   A    0.74    0.01    186.00  0.12    0.23    42.09   1.00
   A    0.73    0.01    217.06  0.12    0.24    40.08   1.00
   A    0.78    0.02    214.82  0.13    0.23    40.51   1.00
   A    0.78    0.02    223.38  0.13    0.24    41.56   1.00
   B    0.61    0.02    319.88  0.12    0.20    21.22   0.87
   B    0.59    0.02    311.05  0.12    0.20    21.02   0.88
   B    0.59    0.02    302.66  0.12    0.23    25.56   0.86
   B    0.60    0.02    312.71  0.13    0.22    26.49   0.83
   B    0.57    0.00    326.00  0.12    0.27    30.13   0.64
   B    0.57    0.01    349.92  0.13    0.28    31.20   0.65
   B    0.56    0.02    355.11  0.13    0.28    30.83   0.64
   B    0.56    0.03    295.61  0.13    0.27    30.42   0.62
   C    0.62    0.00    546.00  0.24    0.10    9.48    1.00
   C    0.60    0.00    544.00  0.24    0.11    10.40   1.00
   C    0.59    0.00    542.33  0.24    0.11    10.56   1.00
   C    0.57    0.00    541.67  0.24    0.11    9.91    1.00
   C    0.56    0.00    539.67  0.24    0.11    11.04   1.00
   C    0.56    0.00    539.00  0.23    0.13    12.15   1.00
   C    0.53    0.00    538.67  0.23    0.12    11.91   1.00
   C    0.54    0.00    539.00  0.24    0.13    11.94   1.00
   E    0.91    0.03    513.69  0.07    0.49    30.73   0.70
   E    0.93    0.03    506.97  0.07    0.50    34.16   0.65
   E    0.82    0.01    549.77  0.09    0.46    29.60   0.73
   E    0.82    0.01    541.11  0.09    0.46    28.89   0.70
   E    0.84    0.01    514.56  0.09    0.45    27.64   0.67
   E    0.87    0.01    516.88  0.09    0.49    33.11   0.61
   E    0.86    0.02    512.50  0.09    0.48    32.57   0.66
   E    0.88    0.01    476.35  0.09    0.46    30.66   0.70
Q: I want to cluster the groups based on the distribution similarity. For example, groups A and B fall in one cluster/segment because their pattern/distribution might be similar in some or all variables.
I don't want to calculate slopes or averages by groups and cluster because the distributions don't seem linear, or normal.
If there is a way to do this in R, it would be helpful too.

