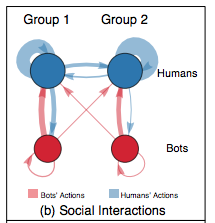
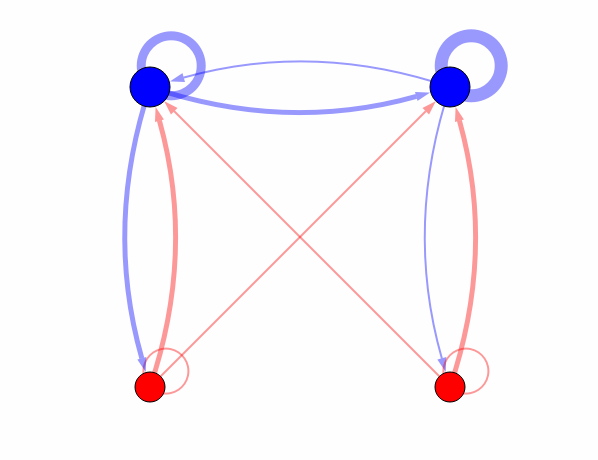
In recent papers of Social Network Analysis , I have been observing this particular type of graph used increasingly. I looked for what they are called to replicate the graph, but couldn't find the name of it?
Plot Reference is here:
Bots increase exposure to negative and inflammatory content in online social systems


igraphpackage. Would an example fromigraphbe helpful? $\endgroup$