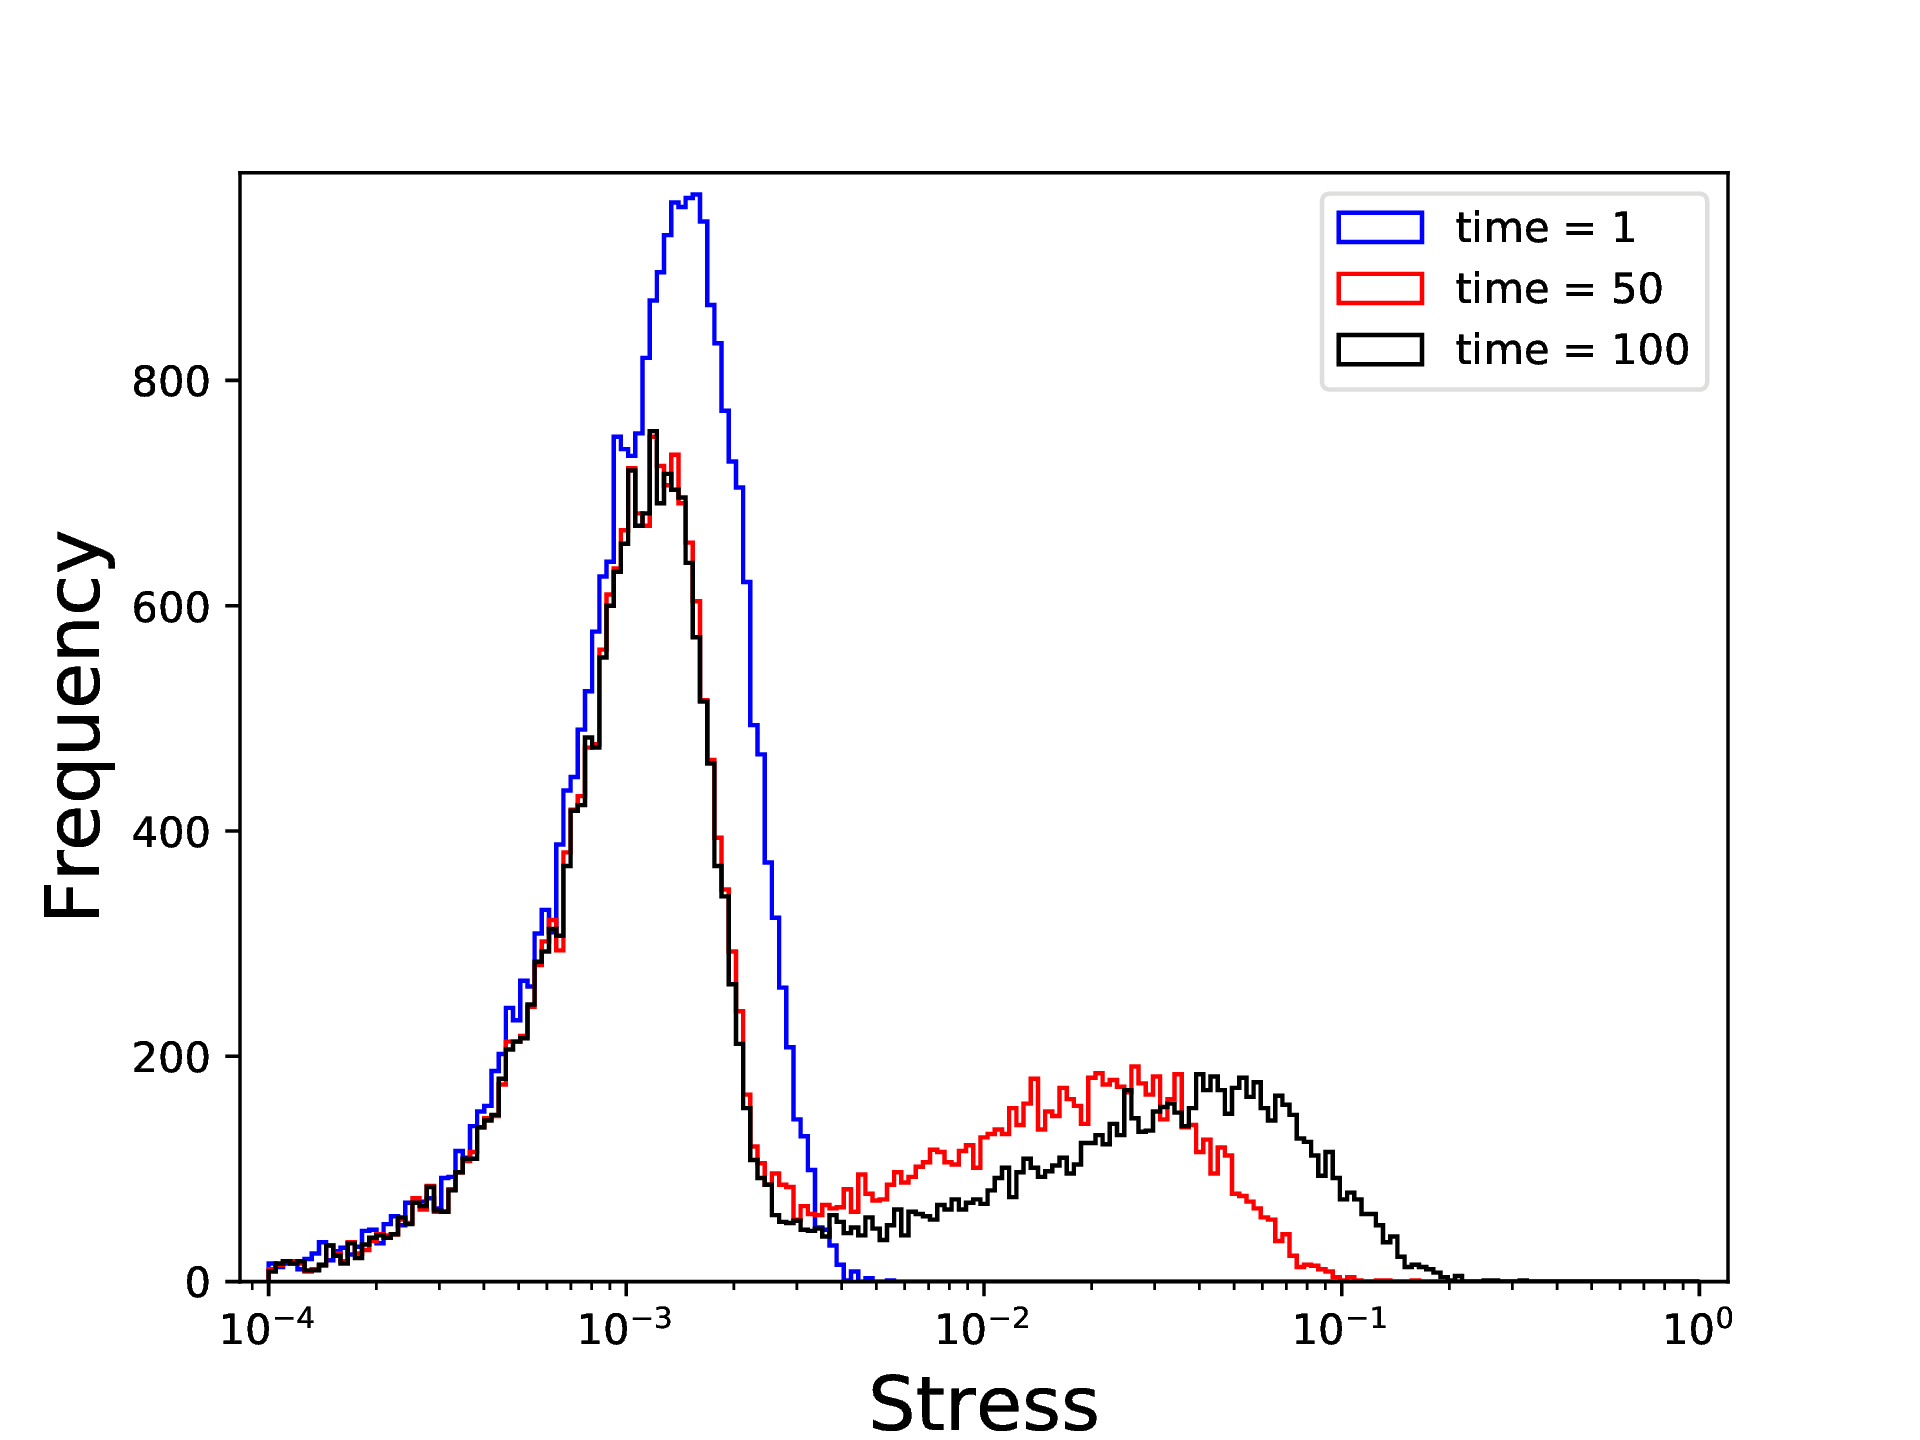
I have measured stress at 1 million points inside a material at 100 time steps. I have made a probability distribution plot for three time steps and I see that the evolution of stress looks like this:

I was wandering if I can use some machine learning algorithm to detect this behavior early on. I have tried PCA, even kPCA to reduce the dimensions but they just give me a random scatter. Also tried k-means and tSNE to segregate different clusters based on their magnitude, but they give a cloud of points.
Also, someone told me that because the magnitude of stress in each point is shifting over time (i.e. some points are stagnating and others are stressing more as time passes), the stress magnitude is not a good candidate for a "feature". Is this true? Should a "feature" stay constant over time?
