There may be many approaches that address your question. The solution you want would build on top of these two existing approaches: (1) outlier detection ; (2) rare event detection. The Outlier detection stems from your mention of GMM and the rare event detection stems from your mention of LSTM.
I am going to focus on Outlier Detection. You can use outlier detection itself as a intermediate step. The novel data would arguably be in the vicinity of the detected outliers.
Among the many outlier detection methods, I'll focus on the Isolation Forest. This is also part of scikit-learn, so you should be able to give it a try relatively easily.
Outlier Detection and Isolation Forest
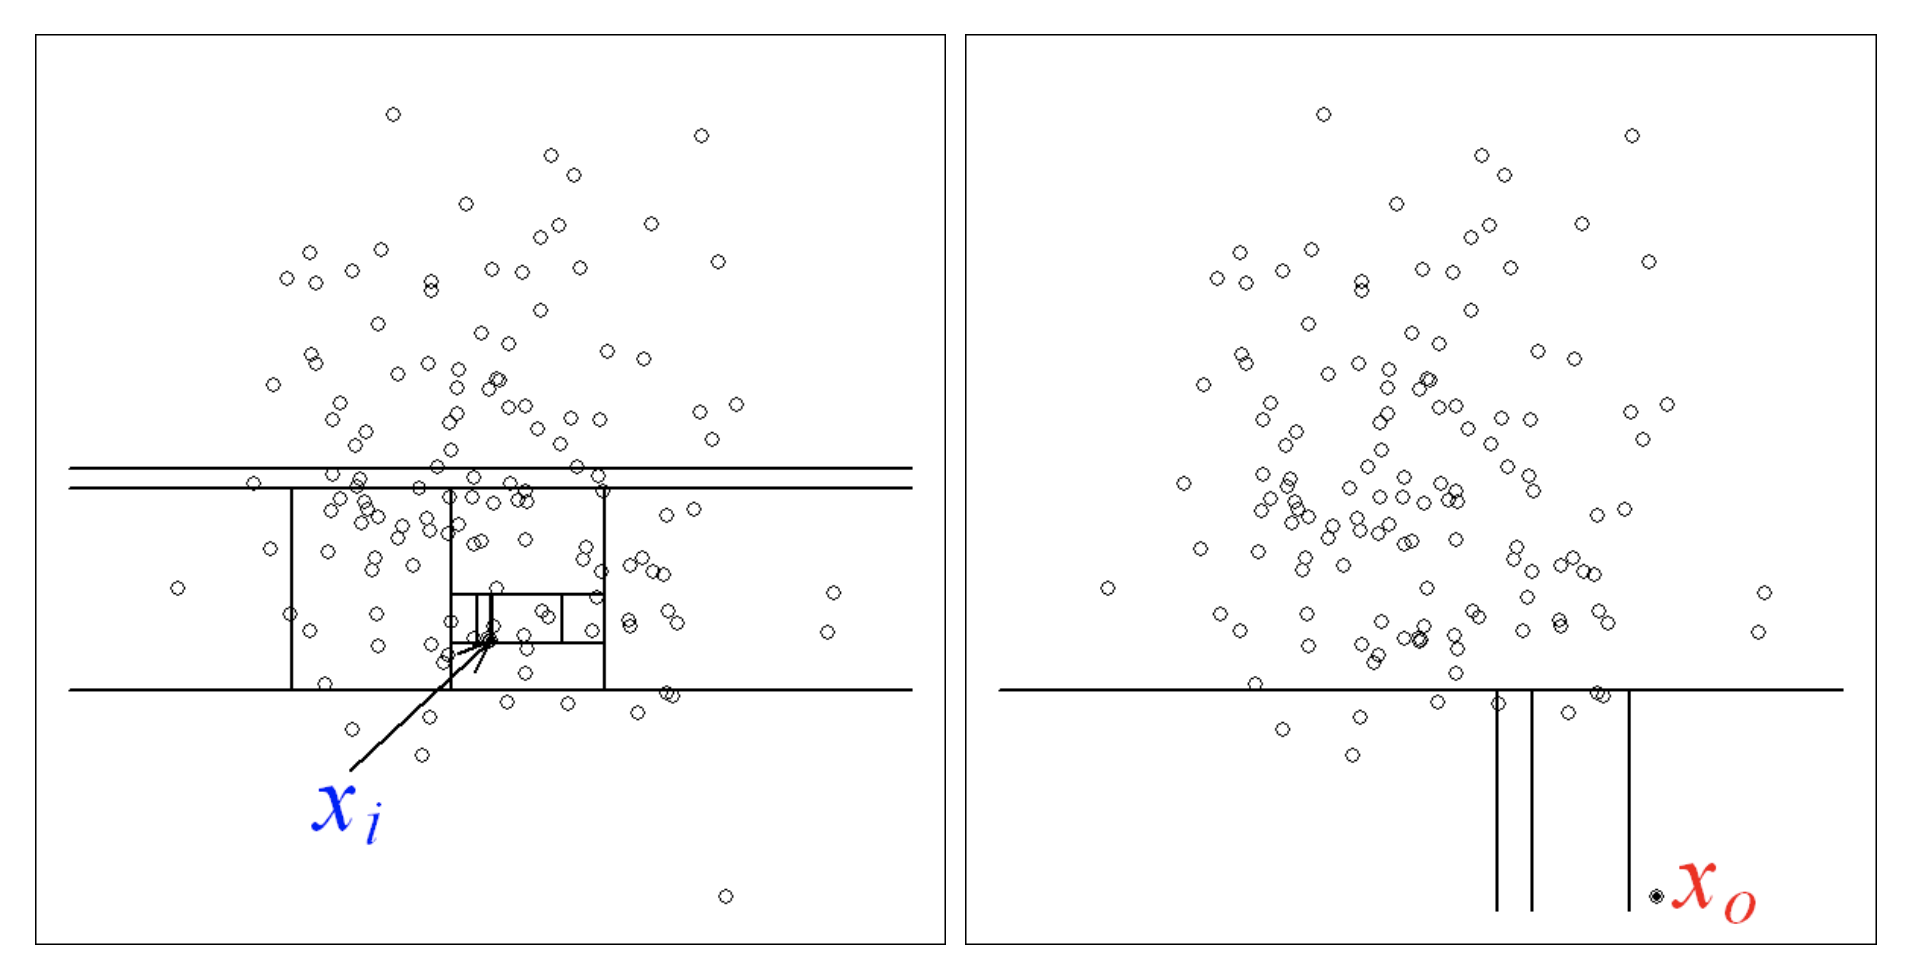
The main idea, which is different from other popular outlier detection methods, is that Isolation Forest explicitly identifies anomalies instead of profiling normal data points. Isolation Forest, like any tree ensemble method, is built on the basis of decision trees. In these trees, partitions are created by first randomly selecting a feature and then selecting a random split value between the minimum and maximum value of the selected feature.
Outliers are less frequent than regular observations and are different from them in terms of values (they lie further away from the regular observations in the feature space). That is why by using such random partitioning they should be identified closer to the root of the tree (shorter average path length, i.e., the number of edges an observation must pass in the tree going from the root to the terminal node), with fewer splits necessary.
 Figure 1
The identification of a normal vs. outlier data-point can be observed in Figure 1. A point from normal distribution (on the left) requires more partitions to be identified than an outlier point (right).
Example using Scikit-Learn
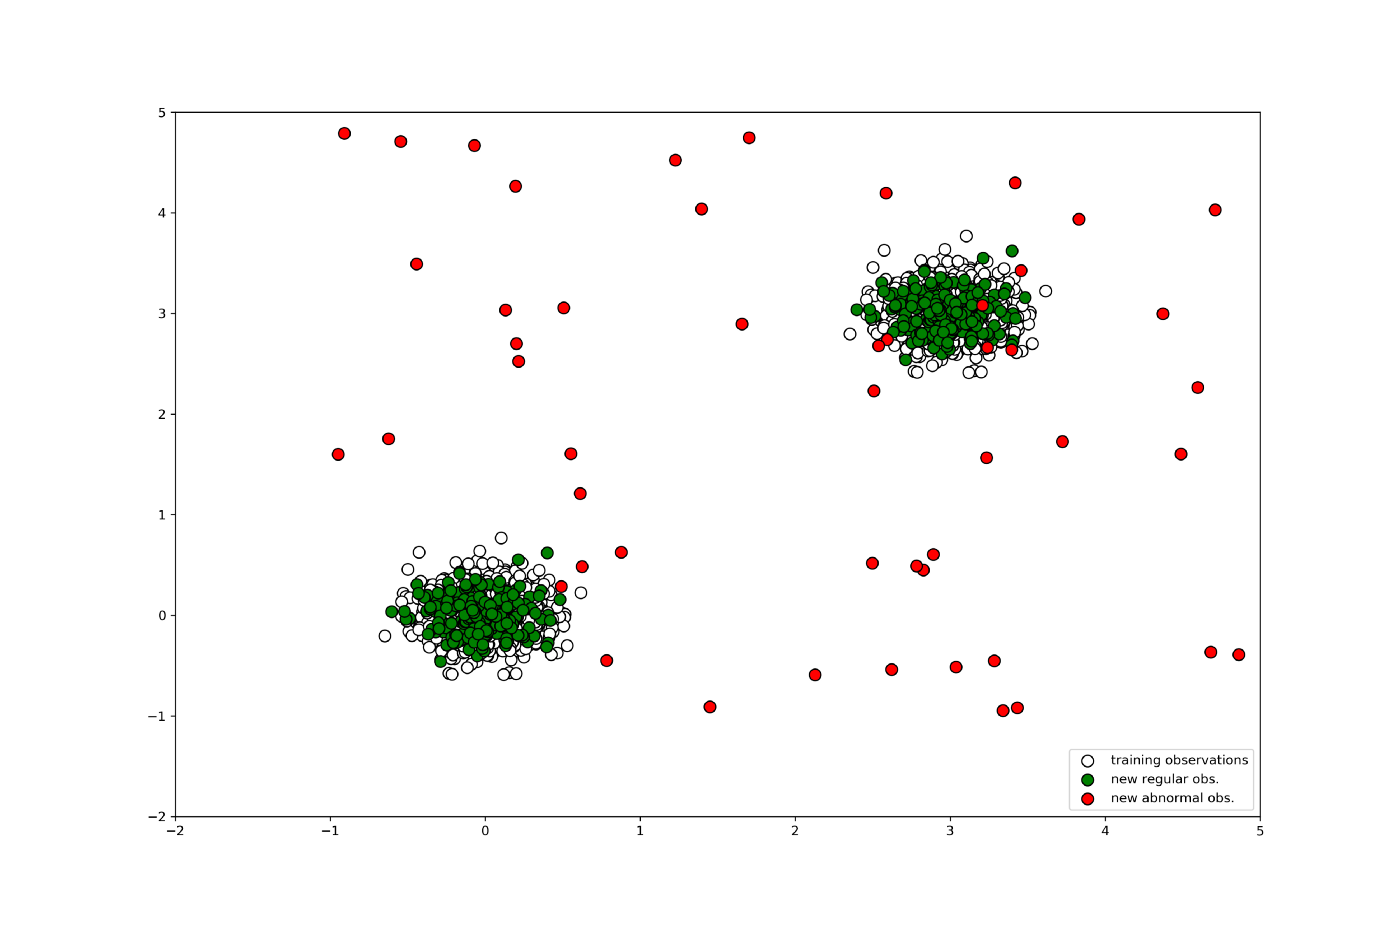
We'll generate data of clusters with normal distribution for training. Then we'll data two types of data points: normal distributed points; and outlier points.
# importing libaries ----
import numpy as np
import pandas as pd
import matplotlib.pyplot as plt
from pylab import savefig
from sklearn.ensemble import IsolationForest
# Generating data ----

rng = np.random.RandomState(42)

# Generating training data
X_train = 0.2 * rng.randn(1000, 2)
X_train = np.r_[X_train + 3, X_train]
X_train = pd.DataFrame(X_train, columns = ['x1', 'x2'])

# Generating new, 'normal' observation
X_test = 0.2 * rng.randn(200, 2)
X_test = np.r_[X_test + 3, X_test]
X_test = pd.DataFrame(X_test, columns = ['x1', 'x2'])

# Generating outliers
X_outliers = rng.uniform(low=-1, high=5, size=(50, 2))
X_outliers = pd.DataFrame(X_outliers, columns = ['x1', 'x2'])
Sample data is shown below:

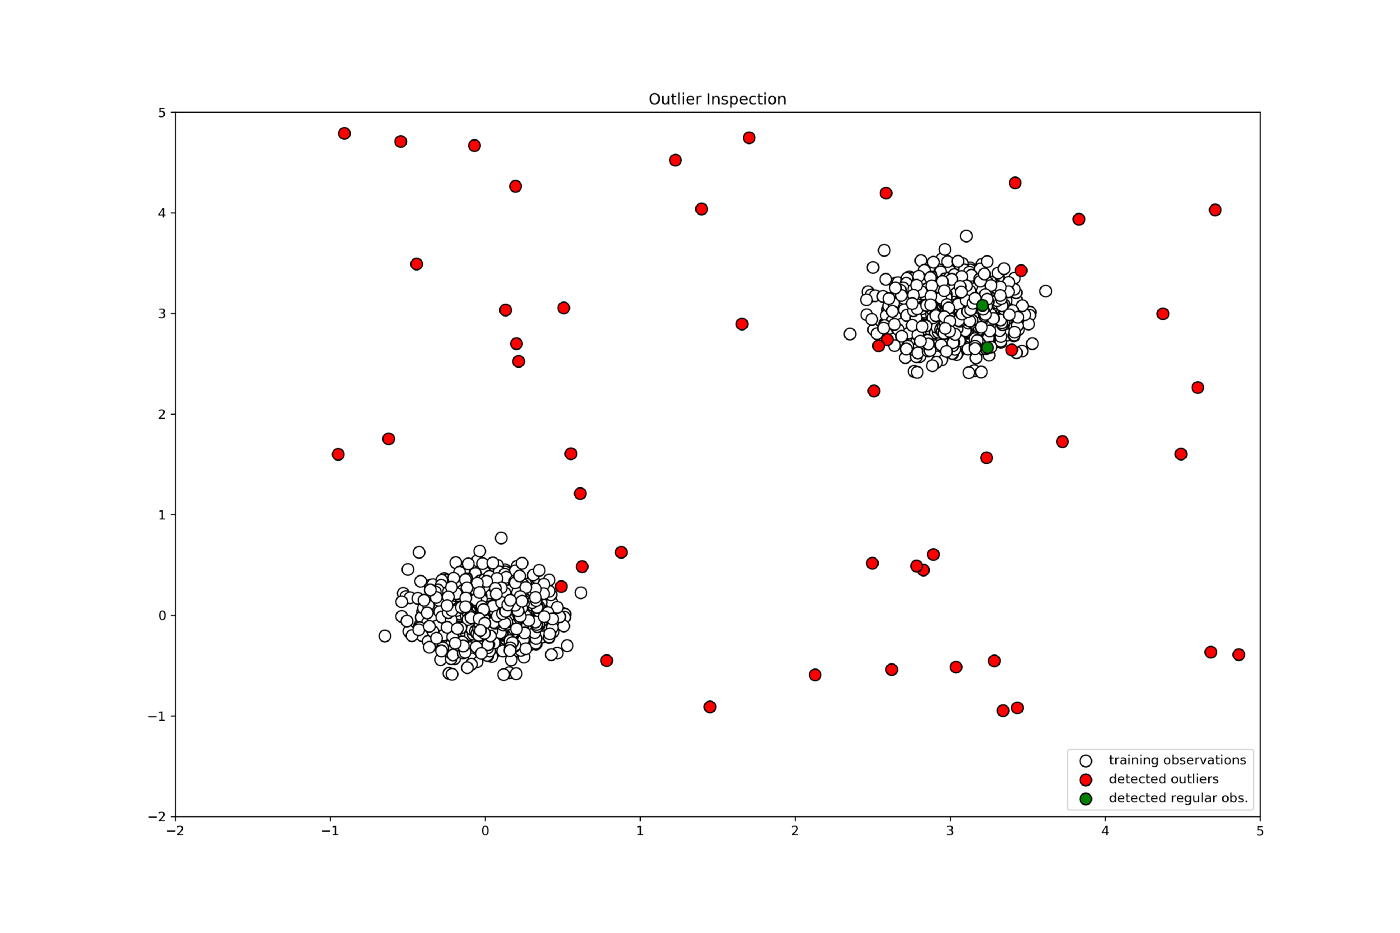
Next, let's use the Isolation Forest in scikit-learn to learn and predict normal and outlier data points.
# Isolation Forest ----

# training the model
clf = IsolationForest(max_samples=100, random_state=rng)
clf.fit(X_train)

# predictions
y_pred_train = clf.predict(X_train)
y_pred_test = clf.predict(X_test)
y_pred_outliers = clf.predict(X_outliers)
# new, 'normal' observations ----
print("Accuracy:", list(y_pred_test).count(1)/y_pred_test.shape[0])

# outliers ----
print("Accuracy:", list(y_pred_outliers).count(-1)/y_pred_outliers.shape[0])

Utility code for plotting data points used here.
# Plotting generated data ----
plt.title("Data")
p1 = plt.scatter(X_train.x1, X_train.x2, c='white',
s=204, edgecolor='k')
p2 = plt.scatter(X_test.x1, X_test.x2, c='green',
s=204, edgecolor='k')
p3 = plt.scatter(X_outliers.x1, X_outliers.x2, c='red',
s=20*4, edgecolor='k')
plt.axis('tight')
plt.xlim((-2, 5))
plt.ylim((-2, 5))
plt.legend([p1, p2, p3],
["training observations",
"new regular obs.", "new abnormal obs."],
loc="lower right")
# saving the figure
plt.savefig('generated_data.png', dpi=300)
plt.show()
Generate novel training data points (aka Data Augmentation)
Now that you have your outliers corrected identified; you can use statistical noise for random perturbation to generate novel training data. I am referring to Variational Autoencoder for Data Augmentation
GAN
Of course, you may later want to employ GAN for data augmentation.
I've tried to give you a fundamental hands-on feel for your problem using Isolation Forests; however if you have more time to invest then VAE or GAN would be your most promising approach.


