What is the very first thing you do when you get your hands on a new data set (assuming it is cleaned and well structured)? Please share sample code snippets as I am sure this would be extremely helpful for both beginners and experienced.
-
5$\begingroup$ This is too broad - please read What types of questions should I avoid asking? in the help center. $\endgroup$– AirCommented Jun 23, 2014 at 16:58
-
$\begingroup$ Depends what type of dataset it is and more importantly what do you want to do with it? Ask yourself these questions... i) what is my objective; ii) if i'm going to train a model, will it be supervised or unsupervised?; iii) if supervised, do i have a train-test split? iv) do i have the reference class labels? etc. $\endgroup$– DebasisCommented Jun 23, 2014 at 17:28
4 Answers
I think this is a reasonable question. Here is what I do:
- Peak at the first few rows
- Visualize the distribution of the features I care about (histograms)
- Visualize the relationship between pairs of features (scatterplots)
I downloaded the abalone dataset from the UCI Machine Learning repository here. Let's say I care about how height and diameter can be used to predict whole weight. For completeness, I've included the step of reading the data from file.
import pandas as pd
import matplotlib.pyplot as plt
import seaborn as sns

data = pd.read_csv("abalone.data", header=False)
data.columns = ["sex", "length", "diameter", "height",
                "whole_weight", "shucked_weight",
                "viscera_weight", "shell_weight", "rings"]
Now we can take a peak at the first few rows:
data.head()

Now, I know that the variables I care about are floating point values and they can be treated as continuous. I want to take a look to see how these three variables are distributed:
fig = plt.figure(figsize=(20,5))
plt.subplot(1, 3, 1)
plt.hist(data['diameter'], normed=True)
plt.title("Diameter")
plt.subplot(1, 3, 2)
plt.hist(data['height'], normed=True)
plt.title("Height")
plt.subplot(1, 3, 3)
plt.hist(data['whole_weight'], normed=True)
plt.title("Whole Weight")
plt.show()

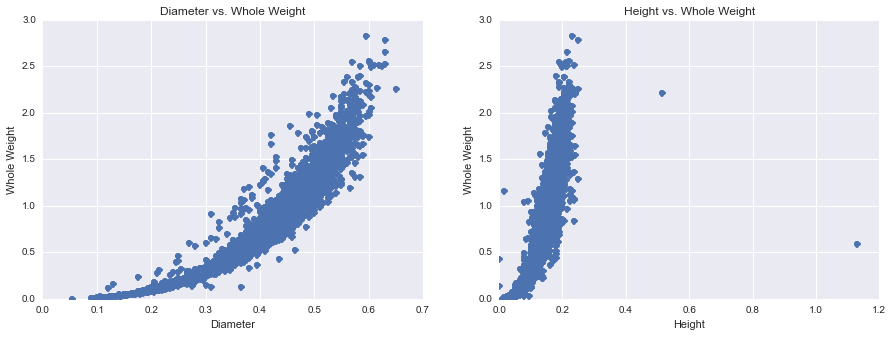
Great! Now, I know that diameter and whole weight are skewed left and right (respectively). I also know that there are some outliers in terms of height (which is why matplotlib gives me extra room to the right of the distribution). Finally, I'd like to see if I can find any visual patterns between my predictors and outcome variable. I use a scatter plot for this:
plt.figure(figsize=(15,5))
plt.subplot(1, 2, 1)
plt.plot(data['diameter'], data['whole_weight'], 'o')
plt.title("Diameter vs. Whole Weight")
plt.ylabel("Whole Weight")
plt.xlabel("Diameter")
plt.subplot(1, 2, 2)
plt.plot(data['height'], data['whole_weight'], 'o')
plt.title("Height vs. Whole Weight")
plt.ylabel("Whole Weight")
plt.xlabel("Height")
plt.show()

Here, I see there is a non-linear relationship between diameter and whole weight and I'm going to have to deal with my height outliers. Now, I'm ready to do some analysis!
Well, you mention in your question of the data being 'clean and well structured'. In practice, close to 70% of the time is spent in doing these two steps. Of course the first thing you do is to separate the training and test data. Considering the plethora of libraries and tools available irrespective of which technology/language you prefer to use, the next step would be to understand the data via graph plots and drawing useful intuitions specific to your target goal. This would then be followed by various other problem specific methods. As pointed out, the question is very broad and citing code snippets is simply not feasible.
While @Ben's answer is nice and partially introduces what should be done first with a newly cleaned data set, I feel that the approach is important enough to have its name presented loud and clear: exploratory data analysis (EDA). Therefore, the short answer to your question is that the first step should be EDA.
This suggestion is supported by most researchers, regardless of their knowledge domain or type of study. Here is how the father of EDA presents his thoughts on the subject (Tukey, 1977, p. 1-3; emphasis mine):
Exploratory Data Analysis (EDA) is detective work – numerical detective work – or counting detective work – or graphical detective work ... unless exploratory data analysis uncovers indications, usually quantitative ones, there is likely to be nothing for confirmatory data analysis to consider ... [it] can never be the whole story, but nothing else can serve as the foundation stone - as the first step.
There is an enormous amount of information on approaches, guidelines and procedures for performing EDA. Potential starting points might include EDA page on the NIST's Engineering Statistics Handbook website, EDA pages on the EPA's website, corresponding chapter from the book "Experimental Design for Behavioral and Social Sciences" and a survey research paper on EDA by Begrens (1997), among many others. It is interesting to note that some sources include less traditional methods into EDA toolset, such as dimensionality reduction and clustering (for example, see the description of this research seminar). While some of the EDA approaches and methods are relatively simple, overall EDA is both art and science, as it combines unstructured (creative) and structured approaches. This aspect is especially important to recognize, as big data exponentially increases complexity of data analyses, including EDA.
References
Behrens, J. T. (1997). Principles and procedures of exploratory data analysis. Psychological Methods, 2(2), 131-160.
Tukey, J. W. (1977). Exploratory Data Analysis. Addison-Wesley.
NOTES: For those interested in the Tukey's classic, it is available on Amazon. Various MOOCs on EDA are also available, for example this one and this one (both are R-focused).
A post by Donne Martin will give you a good idea of performing data analysis on a dataset to make it a tidy dataset in order to apply machine learning algorithms.
Kaggle Machine Learning Competition: Predicting Titanic Survivors | Jupyter nbviewer
Also if you are a beginner I would definitely recommend 7 Steps to Mastering Machine Learning With Python | KDnuggets.
