welcome to StackOverflow.
I will try to summarize as much as possible, but we have to cover a lot of concepts to properly answer your question, if something is not clear, please let a comment and I can change/correct the answer.
First of all, I will assume from the tone of your question that you know what a hypothesis test is.
Second, in the context of Linear Regression, you usually assume that your features are normally distributed, iid (identical independent distributed), constant error variance (that is, they do not vary with X attributes) and so on. These are strong assumptions, and it is important to have it in mind since we are calculating our regression coefficients using data that have these properties.
Put in simple terms, you have your set of features X, in this case A, B, and C, and you want to predict cost, therefore you have the following function:

Thus, you use above equation to minimize the RSS (Residual Sum of Squares) and find out what are your coefficients.
Now, in the context of hypothesis test, you want to verify if your coefficients are statistically relevant, that is, saying it on simple words, you want to check if they are far enough from zero in order you can say they are relevant, not a statistical incident. How exactly you do that? Creating a Null Hypothesis that you coefficient is zero, and an Alternative Hypothesis saying otherwise.

(Example to calculating Hypothesis Test for Beta_1 coefficient)
Then you calculate t-test for your coefficient:

So you are assuming your coefficient has a t-distribution and you want to test if it is far enough from zero to determine its relevancy.

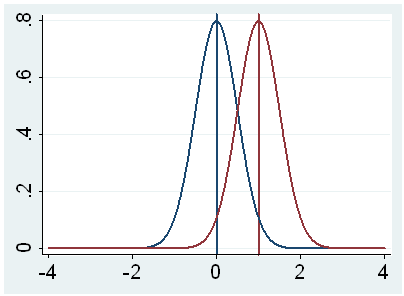
You then calculate your t-test value and estimate a p-value. Therefore, in the end, you will ask the following question: What is the probability that my coefficient comes from a distribution centered around zero? If you have a high p-value, it shows you that probably your coefficient is zero, or close to it and not significant. Otherwise, if you have a low p-value, then it is not likely that it comes from a distribution around zero, then you should take this coefficient (and feature) in your analysis.
In the example from the video, he uses a rule that all coefficients above 0.05 are not statistically relevant. Here, 0.05 is widely used as a cutoff point, but you must be aware that there are a lot of issues regarding this choice and the debate inside scientific community is not settled.
If you really want to understanding all nuances involving Linear Regression, Statistical Tests and problems when modelling data using this technique, I highly recommend that you read the Introduction to Statistical Learning Book - Chapter 3. All images and insights were taken from there, and for me it is my reference book for Machine Learning techniques.
I hope this helps to clarify your question.


