Cool question. My understanding is that the Kolmogorov Smirnov test is what you're after here. You could use the distribution functions in scipy to generate various kinds of distributions and use the K-S test to assess the similarity between your distribution of value variances and each of the distributions you select for a test.
K-S test documentation here: https://docs.scipy.org/doc/scipy-0.14.0/reference/generated/scipy.stats.kstest.html
Here's an example:
import scipy.stats as stats
import numpy as np

target = stats.norm.rvs(0, 1, size=1000) # The target has standard normal distribution

a = stats.kstest(target, stats.norm(0, 1).cdf) # Testing target against a standard normal distribution)
b = stats.kstest(target, stats.chi2(1).cdf) # Testing target against a chi2 distribution

print("""
Target x Normal Distribution: test-stat {0}, p-value {1}
Target x Chi2 Distribution: test-stat {2}, p-value {3}
""".format(a[0], a[1], b[0], b[1]))
And the output is:
Target x Normal Distribution: test-stat 0.022869389923164785, p-value 0.6723583002262676
Target x Chi2 Distribution: test-stat 0.488, p-value 5.343066131071921e-220
The null hypothesis is that the two distributions are identical, so you can see we can confidently reject that hypothesis when testing against the Chi2 distribution but not against the normal distribution.
One potential problem I can see with this approach is that changing the mean and standard deviation parameters of the target or b does result in the test statistic changing to the point that the KS test no longer considers them the same:
stats.kstest(target, stats.norm(10, 1).cdf))
KstestResult(statistic=0.9999999999962224, pvalue=0.0)
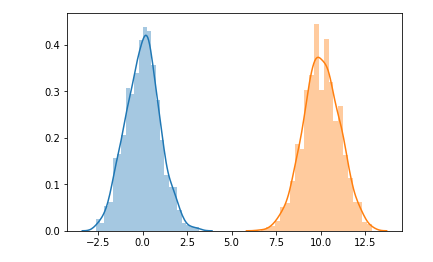
Which is fair in a way, given they no longer overlap in the slightest:

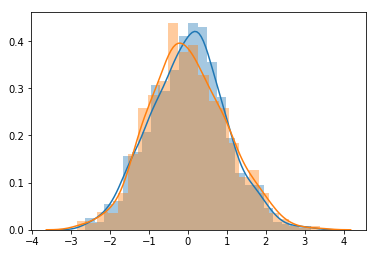
What should happen here depends on whether you want those two distributions to be considered similar or not I guess. If so you'd have to perform some transformation before the test, or use the mean and standard deviation of your target distribution as parameters for stats.norm(). For example we might scale both distributions by removing the mean and dividing by standard deviation, and that way the KS test sees their similarity again.
test = stats.norm.rvs(10, 1, size=1000)

sns.distplot((target - target.mean() / target.std()))
sns.distplot((test - test.mean()) / test.std())

print(stats.ks_2samp((target - target.mean() / target.std()), (test2 - test2.mean()) / test2.std()))

Ks_2sampResult(statistic=0.03200000000000003, pvalue=0.6785103823828891)


