I want to investigate price-setting behavior of airlines -- specifically how airlines react to competitors pricing.
As I would say my knowledge about more complex analysis is quite limited I've done mostly all basic methods to gather a overall view of the data. This includes simple graphs which already help to identify similar patterns. I am also using SAS Enterprise 9.4.
However I am looking for a more number based approach.
Data Set
The (self) collected data set I am using contain around ~54.000 fares.
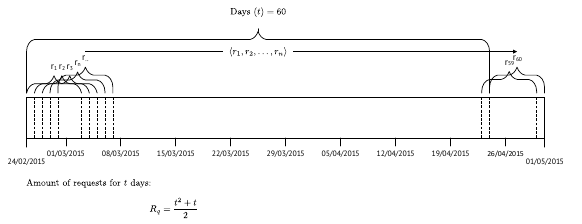
All fares were collected within a 60 day time window, on a daily basis (every night at 00:00).
Hence, every fare within that time window occurs $n$ times subject to the availability of the fare as well as the departure date of the flight, when it is passed by the collection date of the fare. (You can't collect a fare for a flight when the departure date of the flight is in the past)
The unformatted that looks basically like this: (fake data)
+--------------------+-----------+--------------------+--------------------------+---------------+
| requestDate        | price| tripStartDeparture | tripDestinationDeparture | flightCarrier |
+--------------------+-----------+--------------------+--------------------------+---------------+
| 14APR2015:00:00:00 | 725.32    | 16APR2015:10:50:02 | 23APR2015:21:55:04       | XA            |
+--------------------+-----------+--------------------+--------------------------+---------------+
| 14APR2015:00:00:00 | 966.32    | 16APR2015:13:20:02 | 23APR2015:19:00:04       | XY            |
+--------------------+-----------+--------------------+--------------------------+---------------+
| 14APR2015:00:00:00 | 915.32    | 16APR2015:13:20:02 | 23APR2015:21:55:04       | XH            |
+--------------------+-----------+--------------------+--------------------------+---------------+
"DaysBeforeDeparture" is calculated via $I=s-c$ where
- I & interval (days before departure)
- s & date of the fare (flight departure)
- c & date of which the fare was collected
Here is a example of grouped data set by I (DaysBeforeDep.) (fake data!):
+-----------------+------------------+------------------+------------------+------------------+
| DaysBefDeparture | AVG_of_sale | MIN_of_sale | MAX_of_sale | operatingCarrier |
+-----------------+------------------+------------------+------------------+------------------+
| 0               | 880.68           | 477.99           | 2,245.23         | DL           |
+-----------------+------------------+------------------+------------------+------------------+
| 0               | 904.89           | 477.99           | 2,534.55         | DL           |
+-----------------+------------------+------------------+------------------+------------------+
| 0               | 1,044.39         | 920.99           | 2,119.09         | LH               |
+-----------------+------------------+------------------+------------------+------------------+
What I came up with so far
Looking at the line graphs I can already estimate that several lines will have a high correlation factor. Hence, I tried to use correlation analysis first on the grouped data. But is that the correct way? Basically I try now to make correlations on the averages rather then on the individual prices? Is there an other way?
I am unsure which regression model fits here, as the prices do not move in any linear form and appear non-linear. Would I need to fit a model to each of price developments of an airline
PS: This is a long text-wall. If I need to clarify anything let me know. I am new to this sub.
Anyone a clue? :-)
