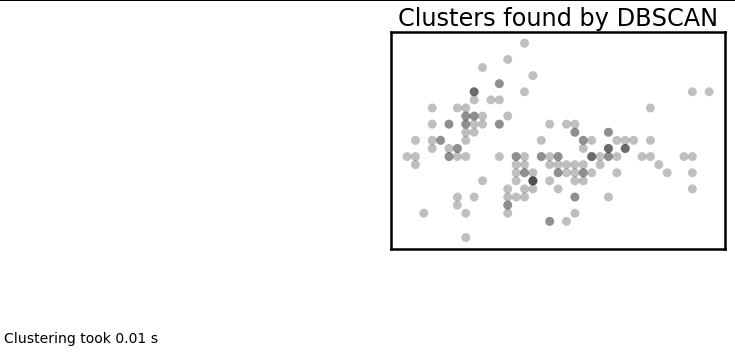
To be honest, I have never heard of "semi-supervised clustering" until right now. There are quite a few clustering techniques out there. Here are 7 popular tequines for clustering. I put together some sample code for you (below). I made it as automated as possible (just copy/paste). Hopefully this will get you pointed in the right direction. Just feed your own data into the X variable (make sure it is an arry).
So: X = df['A'].to_numpy()
from sklearn.cluster import KMeans
import matplotlib.pyplot as plt
from mpl_toolkits.mplot3d import Axes3D
import numpy as np
#%matplotlib inline
from sklearn import datasets#Iris Dataset
iris = datasets.load_iris()
X = iris.data#KMeans
km = KMeans(n_clusters=3)
km.fit(X)
km.predict(X)
labels = km.labels_#Plotting
fig = plt.figure(1, figsize=(7,7))
ax = Axes3D(fig, rect=[0, 0, 0.95, 1], elev=48, azim=134)
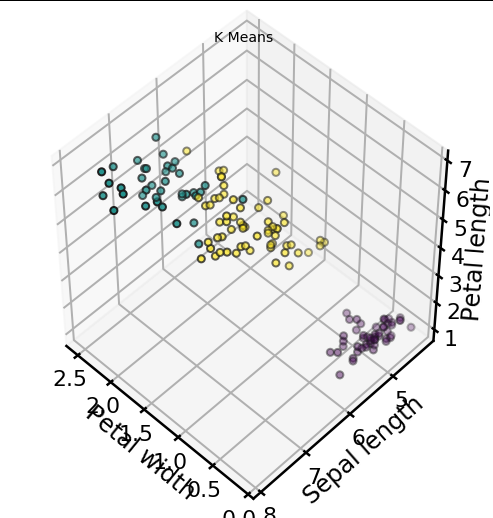
ax.scatter(X[:, 3], X[:, 0], X[:, 2],
          c=labels.astype(np.float), edgecolor="k", s=50)
ax.set_xlabel("Petal width")
ax.set_ylabel("Sepal length")
ax.set_zlabel("Petal length")
plt.title("K Means", fontsize=14)
########################################

from sklearn.mixture import GaussianMixture
import matplotlib.pyplot as plt
from mpl_toolkits.mplot3d import Axes3D
import numpy as np
%matplotlib inline
from sklearn import datasets#Iris Dataset
iris = datasets.load_iris()
X = iris.data#Gaussian Mixture Model
gmm = GaussianMixture(n_components=3)
gmm.fit(X)
proba_lists = gmm.predict_proba(X)#Plotting
colored_arrays = np.matrix(proba_lists)
colored_tuples = [tuple(i.tolist()[0]) for i in colored_arrays]
fig = plt.figure(1, figsize=(7,7))
ax = Axes3D(fig, rect=[0, 0, 0.95, 1], elev=48, azim=134)
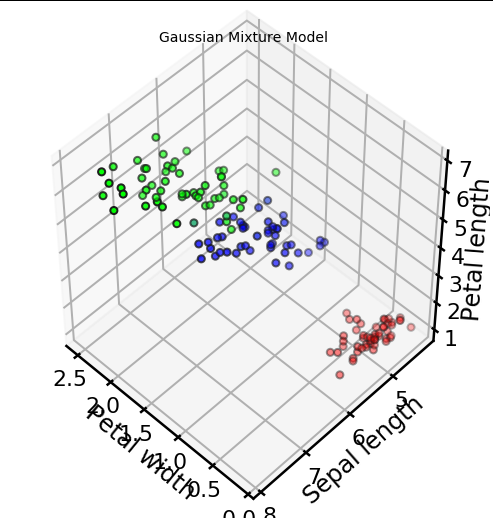
ax.scatter(X[:, 3], X[:, 0], X[:, 2],
          c=colored_tuples, edgecolor="k", s=50)
ax.set_xlabel("Petal width")
ax.set_ylabel("Sepal length")
ax.set_zlabel("Petal length")
plt.title("Gaussian Mixture Model", fontsize=14)
########################################

import numpy as np
import matplotlib.pyplot as plt
import seaborn as sns
import sklearn.cluster as cluster
import time
#%matplotlib inline
sns.set_context('poster')
sns.set_color_codes()
plot_kwds = {'alpha' : 0.25, 's' : 80, 'linewidths':0}

data = X

plt.scatter(data.T[0], data.T[1], c='b', **plot_kwds)
frame = plt.gca()
frame.axes.get_xaxis().set_visible(False)
frame.axes.get_yaxis().set_visible(False)


def plot_clusters(data, algorithm, args, kwds):
    start_time = time.time()
    labels = algorithm(*args, **kwds).fit_predict(data)
    end_time = time.time()
    palette = sns.color_palette('deep', np.unique(labels).max() + 1)
    colors = [palette[x] if x >= 0 else (0.0, 0.0, 0.0) for x in labels]
    plt.scatter(data.T[0], data.T[1], c=colors, **plot_kwds)
    frame = plt.gca()
    frame.axes.get_xaxis().set_visible(False)
    frame.axes.get_yaxis().set_visible(False)
    plt.title('Clusters found by {}'.format(str(algorithm.__name__)), fontsize=24)
    plt.text(-0.5, 0.7, 'Clustering took {:.2f} s'.format(end_time - start_time), fontsize=14)


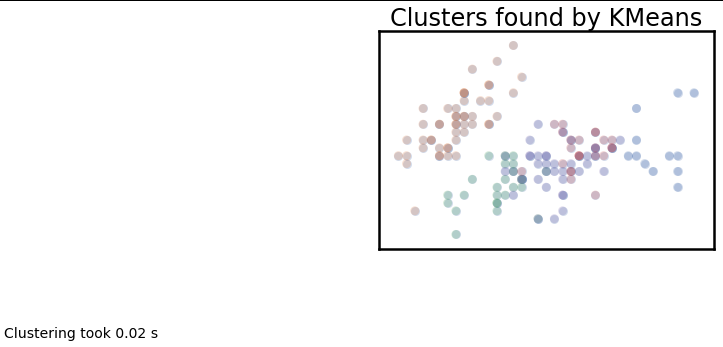
plot_clusters(data, cluster.KMeans, (), {'n_clusters':5})
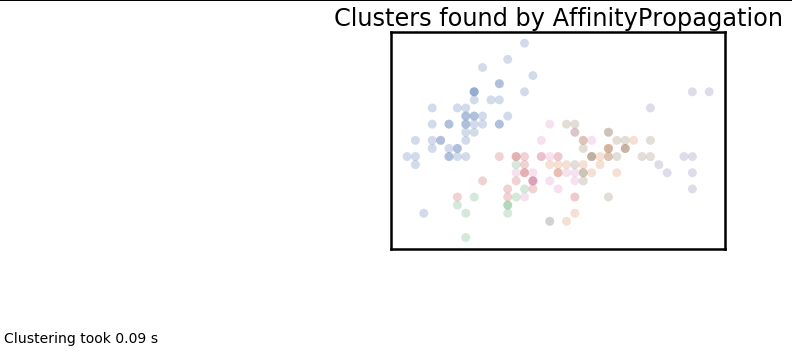
plot_clusters(data, cluster.AffinityPropagation, (), {'preference':-5.0, 'damping':0.95})
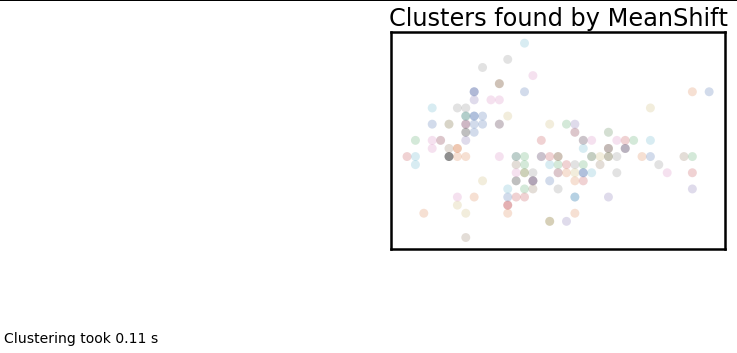
plot_clusters(data, cluster.MeanShift, (0.175,), {'cluster_all':False})
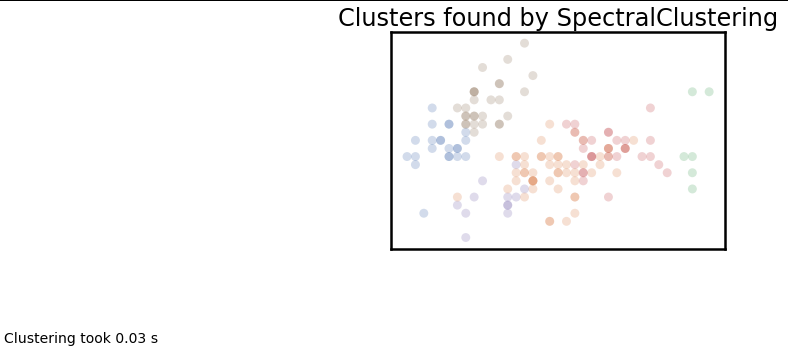
plot_clusters(data, cluster.SpectralClustering, (), {'n_clusters':6})
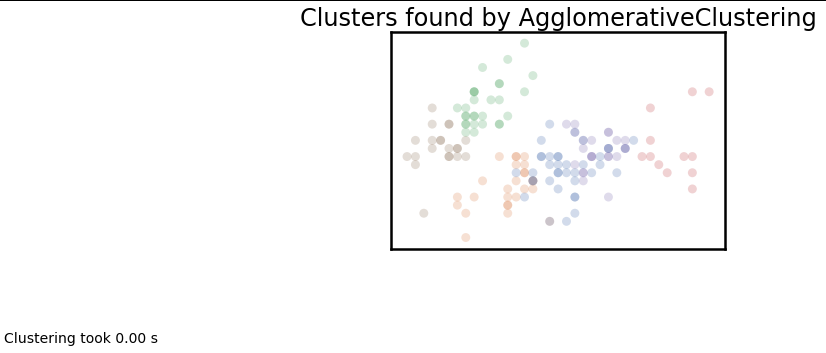
plot_clusters(data, cluster.AgglomerativeClustering, (), {'n_clusters':6, 'linkage':'ward'})
plot_clusters(data, cluster.DBSCAN, (), {'eps':0.025})
